Not All Tightening Cycles Are Created Equal
For the first time in over three years, the Federal Reserve (Fed) raised interest rates this September, prompting concern among investors that tighter monetary policy will be a headwind for equities.
For the first time in over three years, the Federal Reserve (Fed) raised interest rates this September, prompting concern among investors that tighter monetary policy will be a headwind for equities. That worry, however, deserves some nuance. The size and duration of prior tightening cycles have varied dramatically, and so have the equity returns that followed. What does that history suggest about the cycle now under way?
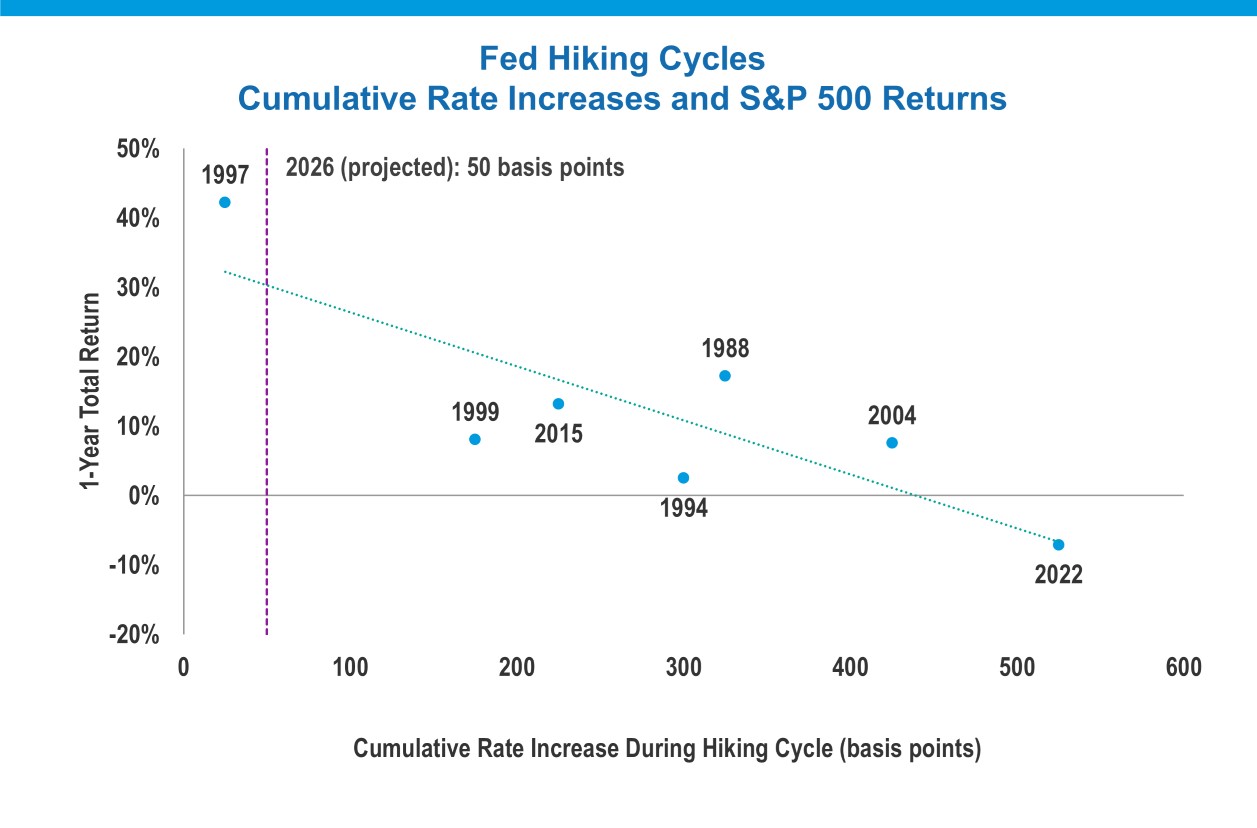
Source: FactSet, S&P Global, and Alger. Each hiking cycle is labeled by the year of its first rate increase. Cumulative increases are measured from the first to the last increase in the federal funds target rate. S&P 500 Index 1-year total returns are measured from the close on the trading day before each cycle’s first rate increase. 2026 cycle estimated at 50 basis points based on the FOMC’s September 2026 Summary of Economic Projections. The green trend line is for illustrative purposes only and does not represent a forecast of future returns. The performance data quoted represents past performance, which is not an indication or a guarantee of future results.
- Since 1988, Fed hiking cycles have averaged nearly 300 basis points (bps). The most aggressive was the 525 bps increase in 2022-2023, when the Fed addressed surging inflation fueled in part by enormous fiscal and monetary stimulus during the Covid-19 pandemic. The smallest was the quick one-and-done rate hike in 1997.
- As shown in the chart above, the S&P 500 has generally risen in the year following the first Fed rate increase. The extent of those gains, though, has depended on the magnitude of the hiking cycle and the economic backdrop. The strongest one-year return came after the 1997 hike, when the Fed raised rates 25 bps without having a major inflation problem. The weakest one-year return came after the first hike of 2022, when the Fed began tightening from near-zero rates with inflation already at a four-decade high. In short, equities have historically fared better at the outset of modest tightening cycles, as the green trend line illustrates.
- Based on the Fed’s own projections, the current hiking cycle is expected to total just 50 bps, mild by historical standards and much more akin to 1997 than to 2022. In our view, the U.S. economy is well equipped to absorb it. Consumer spending and employment remain healthy, and business investment is growing several times faster than U.S. GDP, driven in large part by the artificial intelligence buildout.1 As a result, we believe the economy and equity market can continue to expand, and that secular growth equities driven by innovation rather than the direction of interest rates may be well positioned in this environment.
Visit our
Alger On the Money archive to see more charts from our weekly series.
1 Bureau of Economic Analysis, Q2 2026 GDP; Bureau of Labor Statistics, August 2026 Employment Situation. Real consumer spending grew 3.4% and business investment 8.5% versus GDP growth of 1.5%, annualized; unemployment was 4.1% as of August 2026.
The views expressed are the views of Fred Alger Management, LLC (“FAM”) and its affiliates as of October 2026. These views are subject to change at any time and may not represent the views of all portfolio management teams. These views should not be interpreted as a guarantee of the future performance of the markets, any security or any funds managed by FAM. These views are not meant to provide investment advice and should not be considered a recommendation to purchase or sell securities.
Risk Disclosures: Investing in the stock market involves risks, including the potential loss of principal. Growth stocks may be more volatile than other stocks as their prices tend to be higher in relation to their companies’ earnings and may be more sensitive to market, political, and economic developments.
Past performance is not indicative of future performance. Investors whose reference currency differs from that in which the underlying assets are invested may be subject to exchange rate movements that alter the value of their investments.
Companies involved in, or exposed to, AI-related businesses may have limited product lines, markets, financial resources or personnel as they face intense competition and potentially rapid product obsolescence, and many depend significantly on retaining and growing their consumer base. These companies may be substantially exposed to the market and business risks of other industries or sectors, and may be adversely affected by negative developments impacting those companies, industries or sectors, as well as by loss or impairment of intellectual property rights or misappropriation of their technology. Companies that utilize AI could face reputational harm, competitive harm, and legal liability, and/or an adverse effect on business operations as content, analyses, or recommendations that AI applications produce may be deficient, inaccurate, biased, misleading or incomplete, may lead to errors, and may be used in negligent or criminal ways. AI companies, especially smaller companies, tend to be more volatile than companies that do not rely heavily on technology.
Important Information for US Investors: This material must be accompanied by the most recent fund fact sheet(s) if used in connection with the sale of mutual fund and ETF shares. Fred Alger & Company, LLC serves as distributor of the Alger mutual funds and ETFs.
Important Information for UK and EU Investors: This material is directed at investment professionals and qualified investors (as defined by MiFID/FCA regulations). It is for information purposes only and has been prepared and is made available for the benefit investors. This material does not constitute an offer or solicitation to any person in any jurisdiction in which it is not authorized or permitted, or to anyone who would be an unlawful recipient, and is only intended for use by original recipients and addressees. The original recipient is solely responsible for any actions in further distributing this material and should be satisfied in doing so that there is no breach of local legislation or regulation. Certain products may be subject to restrictions with regard to certain persons or in certain countries under national regulations applicable to such persons or countries.
Alger Management, Ltd. (company house number 8634056, domiciled at 85 Gresham Street, Suite 308, London EC2V 7NQ, UK) is authorised and regulated by the Financial Conduct Authority, for the distribution of regulated financial products and services. FAM, Weatherbie Capital, LLC, and/or Redwood Investments, LLC, U.S. registered investment advisors, serve as sub-portfolio manager to financial products distributed by Alger Management, Ltd.
Alger Group Holdings, LLC (parent company of FAM and Alger Management, Ltd.), FAM, and Fred Alger & Company, LLC are not authorized persons for the purposes of the Financial Services and Markets Act 2000 of the United Kingdom (“FSMA”) and this material has not been approved by an authorized person for the purposes of Section 21(2)(b) of the FSMA.
Important information for Investors in Israel: Fred Alger Management, LLC is neither licensed nor insured under the Israeli Regulation of Investment Advice, of Investment Marketing, and of Portfolio Management Law, 1995 (the "Investment Advice Law"). This document is for information purposes only and should not be construed as an offering of Investment Advisory, Investment Marketing or Portfolio Management services (As defined in the Investment Advice Law). Services regulated under the Investment Advice Law are only available to investors that fall within the First Schedule of Investment Advice Law ("Qualified Clients"). It is hereby noted that with respect to Qualified Clients, Fred Alger Management, LLC is not obliged to comply with the following requirements of the Investment Advice Law: (1) ensuring the compatibility of service to the needs of client; (2) engaging in a written agreement with the client, the content of which is as described in section 13 of the Investment Advice Law; (3) providing the client with appropriate disclosure regarding all matters that are material to a proposed transaction or to the advice given; (4) a prohibition on preferring certain Securities or other Financial Assets; (5) providing disclosure about "extraordinary risks" entailed in a transaction (and obtaining the client's approval of such transactions, if applicable); (6) a prohibition on making Portfolio Management fees conditional upon profits or number of transactions; (7) maintaining records of advisory/discretionary actions. This document is directed at and intended for Qualified Clients only.
S&P 500® Index: An index of large company stocks considered to be representative of the U.S. stock market. Index performance does not reflect deductions for fees, expenses, or taxes. The S&P indexes are a product of S&P Dow Jones Indices LLC and/or its affiliates and has been licensed for use by Fred Alger Management, LLC and its affiliates. Copyright 2026 S&P Dow Jones Indices LLC, a subsidiary of S&P Global Inc. and/or its affiliates. All rights reserved. Redistribution or reproduction in whole or in part are prohibited without written permission of S&P Dow Jones Indices LLC. S&P® is a registered trademark of Standard & Poor’s Financial Services LLC and Dow Jones® is a registered trademark of Dow Jones Trademark Holdings LLC. Neither S&P Dow Jones Indices LLC, Dow Jones Trademark Holdings LLC, their affiliates nor their third party licensors make any representation or warranty, express or implied, as to the ability of any index to accurately represent the asset class or market sector that it purports to represent and neither S&P Dow Jones Indices LLC, Dow Jones Trademark Holdings LLC, their affiliates nor their third party licensors shall have any liability for any errors, omissions, or interruptions of any index or the data included therein. Investors cannot invest directly in any index.
The performance data quoted represents past performance, which is not an indication or a guarantee of future results.
FactSet is an independent source, which Alger believes to be a reliable source. FAM, however, makes no representation that it is complete or accurate.
Alger pays compensation to third party marketers to sell various strategies to prospective investors.