Raising the Earnings Bar
The S&P 500 has gained roughly 13% through July, the kind of run that makes investors wonder whether the market has moved too far, too fast. The fundamentals argue otherwise.
U.S. equities have delivered strong returns this year, with the S&P 500 up roughly 13% through July 31, 2026. These gains may raise concerns that the market has moved too far, too fast, but we believe corporate fundamentals tell a more encouraging story because earnings have grown even faster than the market. Are corporate earnings strong enough to continue supporting equities?
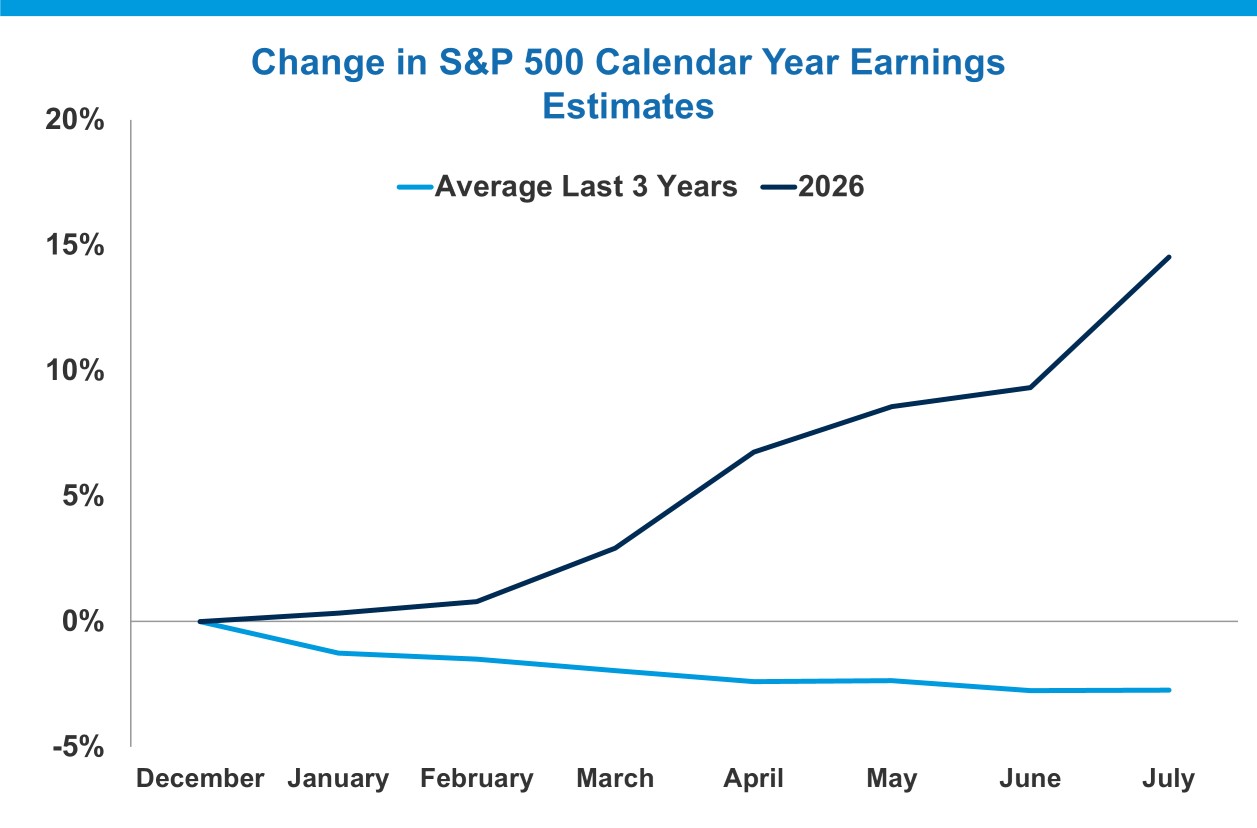
Source: FactSet and S&P Global Inc. as of 7/31/26. Data reflects growth in Next 12-Month consensus EPS estimates.
- Historically, Wall Street analysts begin the year optimistic on company earnings, and their estimates drift lower as the year progresses. By the end of July, when the majority of S&P 500 companies have reported second quarter earnings, calendar year estimates have typically fallen by approximately 3%. This year, the reverse has happened. Earnings estimates for 2026 have risen 15% since the start of the year, as shown in the chart above. Companies continue to clear a rising earnings bar, prompting analysts to raise their full-year estimates, with S&P 500 earnings now on pace to grow roughly 25%.1 According to our research, this would be one of the strongest years of non-recessionary earnings growth in several decades.2 We believe the AI buildout has been an important contributor, turning spending on data centers, chips, and power into revenue for the companies supplying them.
- We believe the strength in earnings places this year’s market performance in a favorable context. Earnings expectations have risen faster than stock prices, which has pushed the index’s forward price-to-earnings (P/E) multiple from 22.0x at the beginning of the year to 19.6x as of July 31, 2026, even as the market has advanced. Evaluating market performance without considering the growth in underlying earnings can provide an incomplete view of valuation (see also
The Platform Illusion).
- We believe this is the mark of a durable market advance, one powered by earnings rather than sentiment, just as we saw in
2025. While the S&P 500 trades around 19.6x forward earnings, above its 20-year historical average, net profit margins sit at a record 16.4%.3 The historical relationship between the two variables suggests that the P/E should be closer to 23.0x, all else equal (see also
Paying Up for Profitability).4 By these measures, we believe the market remains reasonably priced, supported by the rising profits that have historically carried stocks higher.
Visit our
Alger On the Money archive to see more charts from our weekly series.
1 FactSet and S&P Global Inc. Based on consensus estimates as of 7/31/26.
2 FactSet, S&P Global Inc. and Alger from 7/31/96 through 7/31/26.
3 FactSet and S&P Global Inc. as of 7/31/26.
4 FactSet and S&P Global Inc. S&P 500 forward price-to-earnings (P/E) multiples were regressed against net profit margins over the past 20 years to estimate the P/E level historically associated with a given level of profitability. Based on this analysis, a net profit margin of 16.4% would imply a forward P/E of approximately 23.5x. Regression analysis is a statistical technique used to estimate the relationship between two variables.
The views expressed are the views of Fred Alger Management, LLC (“FAM”) and its affiliates as of August 2026. These views are subject to change at any time and may not represent the views of all portfolio management teams. These views should not be interpreted as a guarantee of the future performance of the markets, any security or any funds managed by FAM. These views are not meant to provide investment advice and should not be considered a recommendation to purchase or sell securities.
Risk Disclosures: Investing in the stock market involves risks, including the potential loss of principal. Growth stocks may be more volatile than other stocks as their prices tend to be higher in relation to their companies’ earnings and may be more sensitive to market, political, and economic developments.
Past performance is not indicative of future performance. Investors whose reference currency differs from that in which the underlying assets are invested may be subject to exchange rate movements that alter the value of their investments.
Companies involved in, or exposed to, AI-related businesses may have limited product lines, markets, financial resources or personnel as they face intense competition and potentially rapid product obsolescence, and many depend significantly on retaining and growing their consumer base. These companies may be substantially exposed to the market and business risks of other industries or sectors, and may be adversely affected by negative developments impacting those companies, industries or sectors, as well as by loss or impairment of intellectual property rights or misappropriation of their technology. Companies that utilize AI could face reputational harm, competitive harm, and legal liability, and/or an adverse effect on business operations as content, analyses, or recommendations that AI applications produce may be deficient, inaccurate, biased, misleading or incomplete, may lead to errors, and may be used in negligent or criminal ways. AI companies, especially smaller companies, tend to be more volatile than companies that do not rely heavily on technology.
Important Information for US Investors: This material must be accompanied by the most recent fund fact sheet(s) if used in connection with the sale of mutual fund and ETF shares. Fred Alger & Company, LLC serves as distributor of the Alger mutual funds and ETFs.
Important Information for UK and EU Investors: This material is directed at investment professionals and qualified investors (as defined by MiFID/FCA regulations). It is for information purposes only and has been prepared and is made available for the benefit investors. This material does not constitute an offer or solicitation to any person in any jurisdiction in which it is not authorized or permitted, or to anyone who would be an unlawful recipient, and is only intended for use by original recipients and addressees. The original recipient is solely responsible for any actions in further distributing this material and should be satisfied in doing so that there is no breach of local legislation or regulation. Certain products may be subject to restrictions with regard to certain persons or in certain countries under national regulations applicable to such persons or countries.
Alger Management, Ltd. (company house number 8634056, domiciled at 85 Gresham Street, Suite 308, London EC2V 7NQ, UK) is authorised and regulated by the Financial Conduct Authority, for the distribution of regulated financial products and services. FAM, Weatherbie Capital, LLC, and/or Redwood Investments, LLC, U.S. registered investment advisors, serve as sub-portfolio manager to financial products distributed by Alger Management, Ltd.
Alger Group Holdings, LLC (parent company of FAM and Alger Management, Ltd.), FAM, and Fred Alger & Company, LLC are not authorized persons for the purposes of the Financial Services and Markets Act 2000 of the United Kingdom (“FSMA”) and this material has not been approved by an authorized person for the purposes of Section 21(2)(b) of the FSMA.
Important information for Investors in Israel: Fred Alger Management, LLC is neither licensed nor insured under the Israeli Regulation of Investment Advice, of Investment Marketing, and of Portfolio Management Law, 1995 (the "Investment Advice Law"). This document is for information purposes only and should not be construed as an offering of Investment Advisory, Investment Marketing or Portfolio Management services (as defined in the Investment Advice Law). Services regulated under the Investment Advice Law are only available to investors that fall within the First Schedule of Investment Advice Law ("Qualified Clients"). This document is directed at and intended for Qualified Clients only.
S&P 500® Index: An index of large company stocks considered to be representative of the U.S. stock market. Index performance does not reflect deductions for fees, expenses, or taxes. Investors cannot invest directly in any index.
The performance data quoted represents past performance, which is not an indication or a guarantee of future results.
FactSet is an independent source, which Alger believes to be a reliable source. FAM, however, makes no representation that it is complete or accurate.
Price-to-earnings (P/E) is the ratio for valuing a company that measures its current share price relative to its earnings per share. Earnings per share (EPS) is the portion of a company's earnings or profit allocated to each share of common stock.
Alger pays compensation to third party marketers to sell various strategies to prospective investors.