Log In
Alger
  • About Alger
    • Our History
      Our Investment Approach
      Investment Team
      Careers
      Commitment to Sustainability
      Commitment to Culture & Employees
      Charitable Giving
      We Remember
  • Strategies
    • Strategies Overview
      Asset Classes
      Vehicles
      Strategy Finder
      Large Cap
      Mid Cap
      Small/SMid Cap
      International
      Alternatives
      Specialty
      Focus
      Mutual Funds
      ETFs
      Interval Funds
      SMAs
      Institutional Separate Accounts
      UCITS
      Collective Investment Trusts
  • Insights
    • Insights
      Blogs
      Alger On the Money
      Alger On the Record
      Manager Commentary
      Capital Markets Outlook
      Retirement Solutions
      Viewpoints
      The Power of Focus
  • Newsroom
    Press ReleasesIn the News
  • Contact Us
The PowerfulGale of Innovation
.st0 { fill: #999999; } Explore Insights .st0 { fill: #999999; } Subscribe to Emails .st0 { fill: #999999; } .st0 { fill: #999999; } Download PDF

The Powerful Gale of Innovation

Brad Neuman's Photo

Brad Neuman, CFA;

Senior Vice President
Director of Market Strategy

As new ideas, products, or processes revolutionize the economy, destroying the old and creating the new, we believe our research can help answer one of the central questions of investing: who will win and who will lose?​​​​​

Powerful storms of innovation profoundly revamp economic landscapes. A “gale of creative destruction” can force well-established businesses to sustain damage or even collapse while others climb to new heights.1 As new ideas, products, or processes revolutionize the economy, destroying the old and creating the new, we believe our research can help answer one of the central questions of investing: who will win and who will lose?

New Framework Required for Intense Innovation

Our research and experience show that innovation is the greatest creator and destroyer of wealth. Consider the following:

  • The pace of innovation is accelerating.
  • Intense innovation requires a different investment approach because traditional measures of valuation are less effective.
  • Powerful themes are supporting creative winners while destroying legacy companies.

The Transportation Industry Moves On

Creative destruction occurs frequently. From the demise of the telegraph and the decline of postal mail to the rise of wireless telephony and e-mail, and from radio to television to online video, change consistently condemns losers and anoints new winners.

Transportation is an example. In the beginning of the twentieth century, the horse and carriage dominated transportation in America’s cities. There was little reason to believe that a dramatic change was at hand given that the horse had been the primary form of transportation for hundreds of years. In fact, skepticism in the idea of the automobile was commonplace, with the president of the Michigan Savings Bank telling Henry Ford’s lawyer and early investor in the Ford Motor Company, “the horse is here to stay, but the automobile is only a novelty—a fad.”2

As competition in the automobile industry increased, manufacturing evolved and drove down car prices, which allowed for widespread adoption of the new form of transportation. In 1907, the median cost of an automobile was $3,700, or approximately eight times the annual wage at that time. By 1916, the cost had declined to $1,000 and today, the median price of a car is less than the annual average wage.3 The rise of the automobile was marked by the number of horse and carriage companies dropping from more than 4,600 in 1914 to fewer than 90 by 1929.4 Also, by 1916, the automobile industry employed more individuals than horse and carriage companies.

Clearly, horse and carriage companies were the biggest losers of the transportation evolution, but why was the industry unable to adapt? Indeed, there were strong brand names and employees with knowledge and skills for making vehicles. Their failure was not for lack of trying, as they strived to produce horseless carriages or “buggy-type autos.”5 However, these companies faced the following obstacles:

  • Their skills were largely in woodworking, while automobiles required more metalworking expertise.
  • They had a bias in favor of producing automobile bodies, like carriages, rather than effectively integrating engines.
  • They struggled to adopt assembly-line manufacturing.
The Michigan Buggy Company is an example. It focused on “producing wood bodies, paint, and upholstery work”—it outsourced engine production given its lack of engineering expertise.6 The company, however, ultimately folded.7 In the end, Michigan Buggy and other traditional companies couldn’t compete with the more innovative automobile manufacturers.8 Ford’s lawyer, fortunately for himself, ignored claims that the automobile was a fad. He held on to his $5,000 investment in Ford until 1919 when he sold it for $12.5 million!

Now another revolution in the transportation industry is unfolding with electric vehicles poised to take significant market share from automobiles built around the internal combustion engine. The history of creative destruction implies that the transition for the automobile market incumbents will be difficult to navigate.

CREATIVE DESTRUCTION DRIVES ECONOMIES FORWARD

The U.S. economy has historically been driven forward by creative destruction, or when new and innovative enterprises cause the demise of older, more well-established companies or industries. Creative destruction can wipe out entire professions while giving birth to new ones, usually in different parts of the economy. The workforce is flexible, however, and in some instances, more jobs are created than lost.

In the early twentieth century, hundreds of thousands of Americans were employed as carriage, harness, and blacksmith workers. Today, there are fewer than 5,000 workers in those positions, but there are more than three quarters of a million auto mechanics and almost three million truck drivers—jobs that did not exist in the horse and buggy era. The flexibility of the workforce is a testament to the ingenuity of humankind, which is more than can be said for workhorses, whose population has fallen over 80%.

JOB DESTRUCTION
OccupationCurrent EmployeesEarly 20th Century Employees
Railroad Employees 109,4702,076,000
Carriage & Harness Makers *109,000
Boilermakers *74,000
Cobblers 12,450102,000
Watchmakers *101,000
Farm Workers 480,13011,533,000
Blacksmiths *238,000

JOB CREATION
OccupationCurrent EmployeesEarly 20th Century Employees
Air Transportation 271,880*
Medical Technicians 1,868,550*
Engineers 1,761,03038,000
Computers/Systems/Software 4,184,740*
Auto Mechanics 809,750*
Truck Drivers 2,715,640*
Electricians 655,84051,000

*Less than 5,000

Source: Federal Reserve Bank of Dallas and Bureau of Labor Statistics. Note: Early 20th Century refers to varying points in time (depending on occupation) during 1900-1920 and current refers to 2018 data.

Growth Versus Value in the Winds of Innovation

Much like the dawn of the automotive industry, companies that profit from the “gale of creative destruction” are often the most innovative. Systematically identifying companies that will benefit from intense change is difficult, but history provides valuable insight into identifying winners and avoiding losers of innovation.

Multiple academic studies illustrate that within bursts of innovation, measured by patenting activity, growth equities have higher future profitability and stronger returns than value stocks.9 We believe this is an important observation at a time when the speed of innovation is accelerating. Older innovations such as the stove, washing machine, and dishwasher took many decades to reach 50% penetration of U.S. households, while the internet/World Wide Web and social media took only 14 and 9 years, respectively.10 The faster pace of innovation may mean that value stocks that appear inexpensive may more often be victims of change. On the other hand, more expensive growth stocks may turn out to be much more reasonably priced if growth curves accelerate or shorten. This may be why more innovative companies have significantly outperformed less innovative companies over the past decade (see Figure 1).

Figure 1: Innovative Companies Have Outperformed Over the Past Decade

Cumulative Excess Return
Most Innovative  
52%
 
 
-30%
  Least Innovative

Source: FactSet. Excess performance of the quintiles of R&D as a percentage of revenues with the most innovative being top quintile and the least innovative being bottom quintile of the stocks in the S&P 1500 index. Stocks were divided into quintiles based on R&D spending-to-revenue and calculated monthly for the 10-year period ended August 2021. Innovative companies may be defined as those companies with a high ratio of annual R&D investment to revenue. Investing in innovation is not without risk and there is no guarantee that investments in research and development will result in a company gaining market share or achieving enhanced revenue. The performance data quoted represents past performance, which is not an indication or a guarantee of future results.

​

Our experience and research reinforce the idea that growth stocks are particularly attractive relative to value stocks in periods of intense innovation. In retail, for example, the department store industry looked reasonably valued in 2004 but actually declined over the next 15 years. During the same time, more expensive growth companies such as internet retailers within this sector dramatically outperformed. Additionally, with the digital transformation of business, relatively high multiple, expensive growth stocks of the application software and internet services industries have outperformed the much more inexpensive stocks of the traditional publishing, paper products, and commercial printing industries (see Figure 2.)
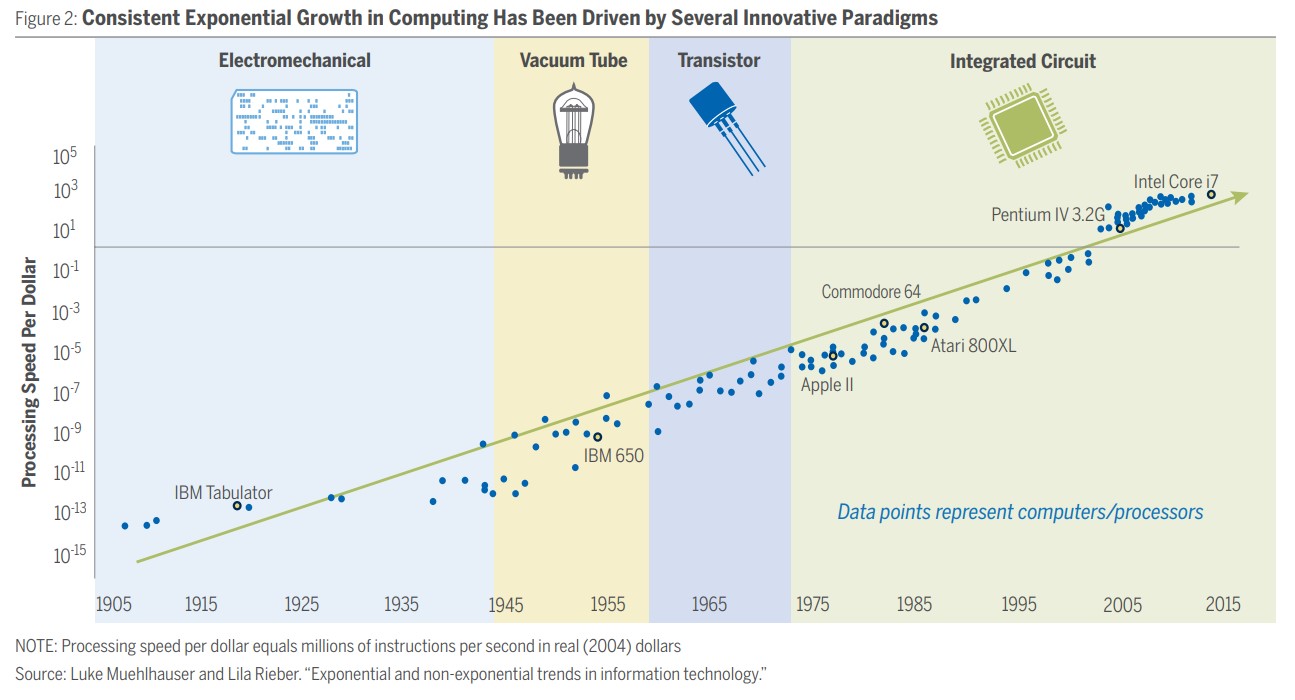
Figure 2 chart

Today’s Thematic Winners and Losers

We believe that one of the greatest drivers of change is the economy’s digital transformation. The rate at which companies digitally transform themselves is key to their ability to remain competitive and relevant within their respective industries. Virtually every industry is digitizing, from retail to media to financial services, advertising, payments, telehealth, dentistry, education, gambling and even dating has gone digital. Businesses are accelerating the digitization of every aspect of their operations from manufacturing to sales and customer service. Those who excel at this transformation will gain market share while the laggards risk becoming obsolete, in our opinion.

Information Technology (IT) spending is also experiencing massive disruption. We expect many traditional IT vendors will struggle to grow revenues and will continue to lose share to cloud-based service providers. With cloud computing, customers essentially rent on-demand access to shared computing resources such as servers, storage, and software maintained at large data centers. This business model benefits from scale and is significantly less expensive for customers than buying expensive equipment for on-premises use. In fact, these services are so inexpensive that we believe they are accelerating innovation and disruption as it’s now cheaper and more efficient to start a company.

Lastly, we believe a renaissance in drug discovery and development is occurring. New insights into the genetic causes of disease are making it possible to develop novel therapies that work more precisely with far better outcomes. While many medications have been designed to treat symptoms of diseases, new drugs target the genetic causes of ailments. Certain diseases that previously were considered to be individual disorders are now more accurately defined as collections of diseases with different genetic drivers. Instead of treating a disease with a one-size-fits-all approach, new more personalized therapies are used that are often more effective and have fewer side effects. We believe there are attractive investment opportunities among many of the drug makers employing these new technologies and among companies that provide services to them such as tools, materials, or software.

Which Way Will the Wind Blow?

The key for investors is to determine which way the winds of creative destruction are blowing and find companies that are producing innovation to exploit change. At Alger, our work suggests that short-term valuation metrics, while important, are less critical than innovation and its impact on long-term discounted cash flows. While simple arithmetic allows investors to calculate price-to-earnings and other similar ratios, we believe the best potential for excess returns resides with skilled analysts who understand the impact of change and can identify the industry leaders of tomorrow. Since our research shows that investing in innovation requires a different approach, we believe our experience, which spans more than 50 years and includes a focus on change and growth, is a valuable asset in the quest to generate value for our clients.


View the PDF​​

​
​

Recommended Insights for You:


  1. Joseph Schumpeter, “Capitalism, Socialism and Democracy,” Stockholm University, 1943.
  2. The City of Huntington Woods, Historic District Proposal, Final Report, “Rackham Historic District,” presented November 21, 2006, p. 9.
  3. Alasdair Nairn, “Engines that Move Markets,” John Wiley & Sons, 2002.
  4. U.S. Bureau of the Census, “Fifteenth Census of the United States: Manufacturers, 1929,” Government Printing Office, 1933
  5. Thomas A. Kinney, “The Carriage Trade,” The Johns Hopkins University Press , 2004, p. 273.
  6. “Michigan Buggy Company,” Kalamazoo Public Library. http://www.kpl.gov/local-history/business/michigan-buggy.aspx
  7. Alasdair Nairn, “Engines that Move Markets,” John Wiley & Sons, 2002.
  8. Studebaker was probably the most successful horse and carriage company in transitioning to the automobile industry but it was easily outpaced by the newcomers, General Motors and Ford, which had market capitalizations approximately 13 times and 5,500 times that of Studebaker, which eventually entered receivership in 1926 (Nairn, 2002).
  9. Joachim Grammig and Stephan Jank, “Creative Destruction and Asset Prices,” Journal of Finance and Quantitative Analysis,” 2015; Leonid Kogan, Dimitris Papanikolaou, Noah Stoffman, “Winners and Losers: Creative Destruction and the Stock Market,” 2015.
  10. Asymco.

The views expressed are the views of Fred Alger Management, LLC (“FAM”) and its affiliates as of November 2021. These views are subject to change at any time and may not represent the views of all portfolio management teams. These views should not be interpreted as a guarantee of the future performance of the markets, any security or any funds managed by FAM. These views are not meant to provide investment advice and should not be considered a recommendation to purchase or sell securities.

Risk Disclosures: Investing in the stock market involves risks, including the potential loss of principal. Growth stocks may be more volatile than other stocks as their prices tend to be higher in relation to their companies’ earnings and may be more sensitive to market, political, and economic developments. Local, regional or global events such as war, acts of terrorism, the spread of infectious illness such as COVID-19 or other public health issues, recessions, or other events could have a significant impact on investments. Past performance is not indicative of future performance. Investors whose reference currency differs from that in which the underlying assets are invested may be subject to exchange rate movements that alter the value of their investments.

Investing in innovation is not without risk and there is no guarantee that investments in research and development will result in a company gaining market share or achieving enhanced revenue. Companies exploring new technologies may face regulatory, political or legal challenges that may adversely impact their competitive positioning and financial prospects. Also, developing technologies to displace older technologies or create new markets may not in fact do so, and there may be sectorspecific risks as well. As is the case with any industry, there will be winners and losers that emerge and investors therefore need to conduct a significant amount of due diligence on individual companies to assess these risks and opportunities.

Important Information for US Investors: This material must be accompanied by the most recent fund fact sheet(s) if used in connection with the sale of mutual fund or ETF shares. Fred Alger & Company, LLC serves as distributor of the Alger mutual funds.

Important Information for UK and EU Investors: This material is directed at investment professionals and qualified investors (as defined by MiFID/FCA regulations). It is for information purposes only and has been prepared and is made available for the benefit investors. This material does not constitute an offer or solicitation to any person in any jurisdiction in which it is not authorised or permitted, or to anyone who would be an unlawful recipient, and is only intended for use by original recipients and addressees. The original recipient is solely responsible for any actions in further distributing this material and should be satisfied in doing so that there is no breach of local legislation or regulation.

Certain products may be subject to restrictions with regard to certain persons or in certain countries under national regulations applicable to such persons or countries.

Alger Management, Ltd. (company house number 8634056, domiciled at 78 Brook Street, London W1K 5EF, UK) is authorised and regulated by the Financial Conduct Authority, for the distribution of regulated financial products and services. FAM and/or Weatherbie Capital, LLC, U.S. registered investment advisors, serve as subportfolio manager to financial products distributed by Alger Management, Ltd.

Alger Group Holdings, LLC (parent company of FAM and Alger Management, Ltd.), FAM, and Fred Alger & Company, LLC are not an authorized persons for the purposes of the Financial Services and Markets Act 2000 of the United Kingdom (“FSMA”) and this material has not been approved by an authorized person for the purposes of Section 21(2)(b) of the FSMA.

Important information for Investors in Israel: This material is provided in Israel only to investors of the type listed in the first schedule of the Securities Law, 1968 (the “Securities Law”) and the Regulation of Investment Advice, Investment Marketing and Investment Portfolio Management Law, 1995. The Fund units will not be sold to investors who are not of the type listed in the first schedule of the Securities Law.

The S&P 500 Index is an unmanaged index generally representative of the U.S. stock market without regard to company size. The S&P 500 Growth and Value style indices are weighted by float market capitalization and they measure the performance of U.S. equities fully or partially categorized as either growth or value stocks, as determined by Style Scores for each security. The S&P Composite 1500 is an unmanaged index that covers approximately 90% of the U.S. market capitalization. The indices presented are provided for illustrative purposes, reflect the reinvestment of dividends and do not assess fees and expenses that would have the effect of reducing returns. Investors cannot invest directly in any index. The index performance does not represent the returns of any portfolio advised by Fred Alger Management, LLC and actual client results might differ materially than the indices shown. Note that past performance is no guarantee of future results. Comparison to a different index might have materially different results than those shown. Earnings per share (EPS) is a company’s net profit divided by the number of common shares it has outstanding. EPS indicates how much money a company makes for each share of its stock, and is a widely used metric to estimate corporate value.

Fred Alger Management, LLC 100 Pearl Street, 27 th Floor, New York, NY 10004 / 212.806.8800​

POGALE1121 ​

RecommendedContent Title

ETF Investors

This ETF is different from traditional ETFs.

Traditional ETFs tell the public what assets they hold each day. This ETF will not. This may create additional risks for your investment. Specifically:

You may have to pay more money to trade the ETF’s shares. This ETF will provide less information to traders, who tend to charge more for trades when they have less information.

The price you pay to buy ETF shares on an exchange may not match the value of the ETF’s portfolio. The same is true when you sell shares. These price differences may be greater for this ETF compared to other ETFs because it provides less information to traders.

These additional risks may be even greater in bad or uncertain market conditions.

The differences between this ETF and other ETFs may also have advantages. By keeping certain information about the ETF confidential, this ETF may face less risk that other traders can predict or copy its investment strategy. This may improve the ETF’s performance. If other traders are able to copy or predict the ETF’s investment strategy, however, this may hurt the ETF’s performance. For additional information regarding the unique attributes and risks of this ETF, please refer to the prospectus.

ABOUT ALGER

  • Our History
  • Our Investment Approach
  • Investment Team
  • Careers
  • Charitable Giving
  • We Remember
  • Documents & Forms
  • Fund Literature
  • FAQs

ESG

  • Commitment to Sustainability
  • Alger's Approach to ESG Investing and Oversight
  • Weatherbie’s Approach to ESG Investing and Oversight
  • Redwood's Approach to Responsible Investing
  • Commitment to Culture & Employees

ASSET CLASSES

  • Large Cap
  • Mid Cap
  • Small/SMid Cap
  • International
  • Alternatives
  • Specialty
  • Focus

VEHICLES

  • Mutual Funds
  • ETFs
  • Interval Funds
  • SMAs
  • Institutional Separate Accounts
  • UCITS
  • Collective Investment Trusts

TOOLS

  • Strategy Finder
  • 10 Year Estimator
  • Quarterly Expense Estimator

INSIGHTS

  • Featured Insights
  • Capital Markets Outlook
  • Alger On the Money
  • Alger On the Record
  • The Alger Podcast
  • Search All Insights

NEWSROOM

  • Press Releases
  • In the News

LITERATURE

  • Mutual Funds
  • SMAs
  • Institutional Separate Accounts
  • UCITS

CONTACT US

  • All Inquiries

LEGAL NOTICES

  • Proxy Information
  • 2026 Estimated Dividends & Distribution Information
  • Sales Charges
  • Customer Relationship Summaries
  • UK Investor Report
  • Form ADVs
  • Interval Fund Repurchasing Schedule
View Mobile Site

Copyright Alger All Rights Reserved Privacy Policy Business Continuity Terms and Conditions
youtube channel LinkedIn Instagram