Pre-existing bias prevents individuals from recognizing change. Recently, there have been pervasive worries about a long-term shift down in U.S. productivity growth and the resulting negative impact to the economy. We believe economists and commentators interpreting this data have views that are heavily shaped by pre-existing biases, which is obscuring the real story behind productivity.
Recognizing and Removing Pre-Existing Bias
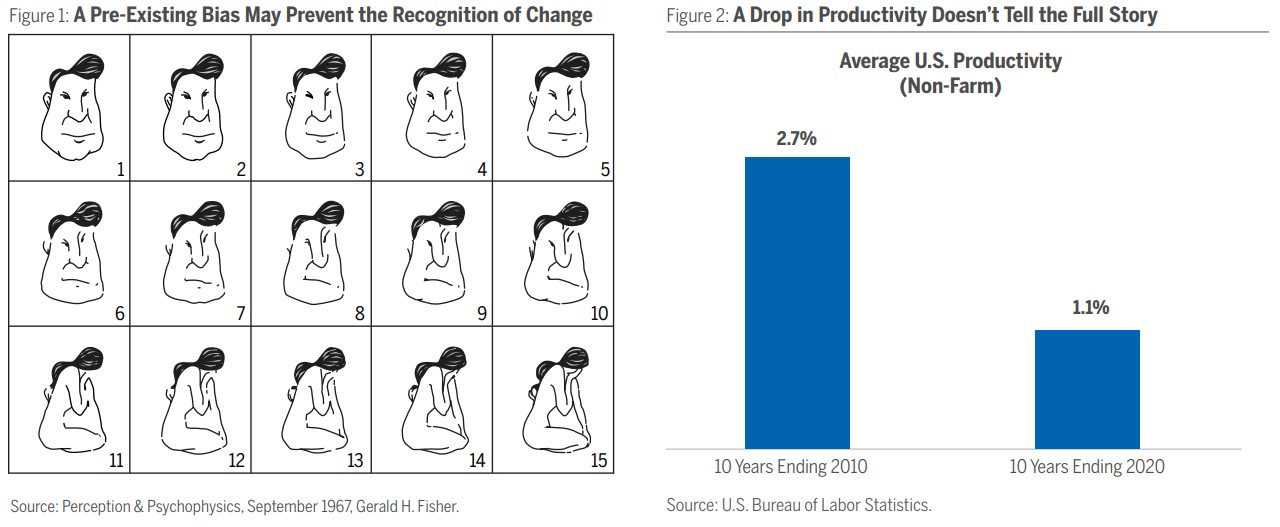
Take a good look at only the first five images in Figure 1. You should clearly see a man’s face. If you then look at image eight, you will probably still see the man’s face because your mind is conditioned to see it. What you may miss is the image of the woman. Once you see the evolution of all of the images, however, the woman’s image becomes obvious. Why did you continue to see the man’s face as you viewed the images? You had a pre-existing bias that prevented you from recognizing this change.
At first glance, the economic data is supportive of lower productivity growth as it has weakened over the past decade (see Figure 2). Productivity, or output per hour, drives GDP growth; therefore, lower productivity would have significant negative implications for the country’s economy. However, we believe that innovation is strong and that some of the perceived productivity and growth issues may be a result of not recognizing change arising from three issues:
- mismeasurement of pricing data
- exclusion of key goods and services from economic data
- lagging impact of innovation
At Alger, we have focused our research on analyzing change for more than 50 years. Our investment process is built so that our analysts remove pre-existing biases to obtain independent views. We are optimistic that change is creating real progress that is being underappreciated, and we believe it will produce gains in profits for companies and improve the quality of life for consumers well into the future.
Mismeasurement of Pricing Data Affects Economic Statistics
The U.S. government frequently adjusts prices of goods to account for changes in quality. However, these so-called “hedonic adjustments” are very difficult to estimate and are only done in a handful of areas.
1 While these changes have had a small aggregate impact, real world experience suggests that there have been massive improvements in quality via innovation. To see the large improvement in quality and price reduction resulting from innovation, consider that 20 years ago, many well-off U.S. citizens owned a camera, a video camera, a CD player, a stereo, a video game console, a cell phone, a watch, an alarm clock, a set of encyclopedias, a world atlas, a Thomas Guide, and other assets that had a combined cost of more than $10,000. All of those items are now either standard on smartphones or they can be purchased at an app store for less than the cost of a cup of coffee.
2 A Federal Reserve working paper stated “you see massive connectivity and ever-cheaper computing power everywhere but in the productivity data.”
3 The piece points out many areas in which the U.S. government’s price measurement may not be accurate, such as in semiconductors, prepackaged software, and products with significant electronic content.
Generally, it is hard for the economic statistics to capture quality improvements inherent in technological advances. Less than a quarter of Americans had computers and fewer than two out of 100 people had mobile phones or Internet service 25 years ago, but now 98% of people have mobile phones and the vast majority of people have Internet access, oftentimes through multiple devices.
4 With all of this computing power proliferating and its effective cost decreasing, one would think the total Consumer Price Index hedonic quality adjustment would be more significant than the virtually immaterial result that has been reported.
5 Another fast growing sector of the economy with measurement problems is healthcare. Government statistics essentially do not adjust for quality improvements in healthcare inflation despite the clear evidence that healthcare is more effective today than in the past, as average life expectancy in the United States has increased four years to 79 over the past 30 years.
6 Many studies have shown that if quality improvements were factored into healthcare spending on conditions like heart attacks and colon cancer, inflation in those areas would be much lower.
7 Given that spending on technology and healthcare are two of the fastest growing areas in the economy, any measurement errors are likely having a greater impact on inflation, real output, and productivity than ever before. Evidently, “real” economic data is not telling the whole story.
Excluding Key Goods and Services Skews Data
The price measurement of technology, healthcare, and other products is clearly an issue in measuring inflation and real growth, but we are most concerned when goods and services are not weighted properly in the statistics or, worse yet, not included at all.
The internet is a prime example where large portions of value-added services may be excluded from the official statistics, oftentimes because they are free. The advertising dollars that go to support many of these services are not captured in the statistics used to calculate real growth, inflation, or productivity.
For example, individuals enjoy enhanced productivity and other benefits from internet search services. In fact, it is estimated that Google’s search engine saves U.S. consumers $150 billion annually.
8 Studies have found that free digital services generated incremental consumer surplus of ¾ of a percentage point of GDP per year.
9 In fact, more recent studies have shown unaccounted consumer value derived from the internet to be much larger.
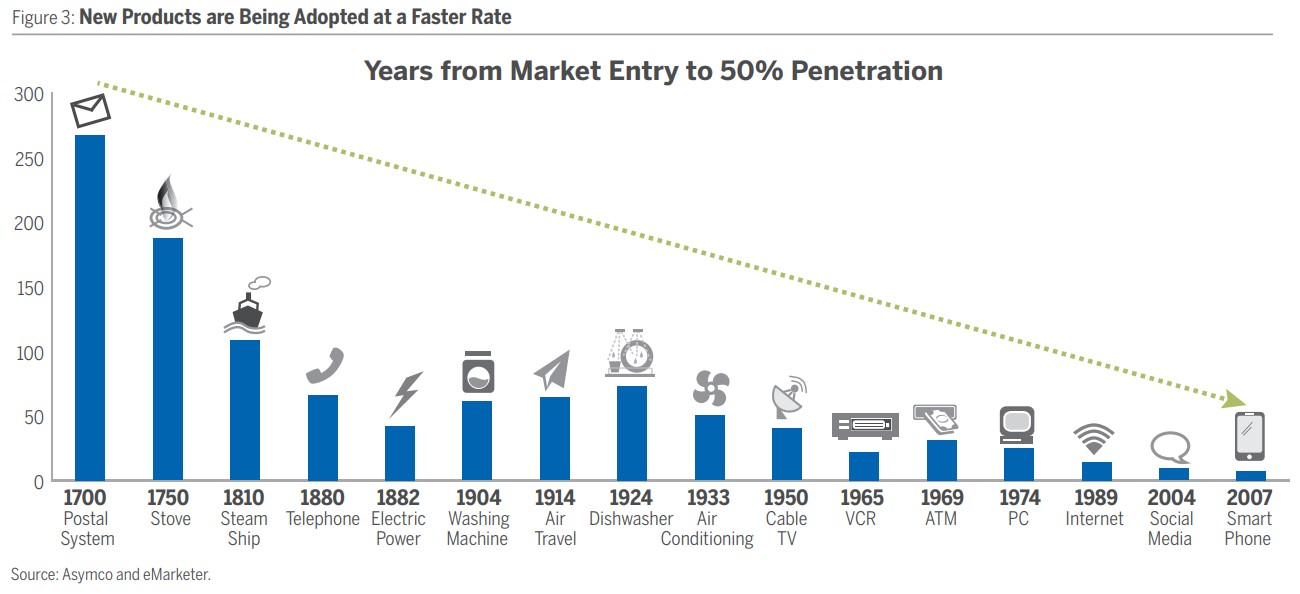
10 The internet and other recent innovations have been spreading through society faster than ever (see Figure 3). People now spend nearly seven hours daily with digital media, reflecting a double-digit growth rate over the past few years.
11 The fast growth of time spent online, combined with increasing functionality of internet services such as translation, search, mapping, etc., implies that any mismeasurement has had an increasingly large effect on the statistics in recent years. Indeed, faster diffusion of innovation may mean traditional economic analysis needs to be adapted to this new reality.
Innovation’s Impact on Data Suffers a Significant Lag
It is also possible, and indeed likely, that today’s innovations will foster an increase in growth and productivity after the economy has learned to better incorporate them into the fabric of business. This lag effect has occurred at various points in U.S. history.
For example, the electric motor did not immediately revolutionize production. First, U.S. manufacturers had to adapt the way they produced goods to the new technology. Instead of building a multi-story plant around a central power source, firms could build a single-story plant with multiple electric motors. This paved the way for the assembly line method of production. Similarly, the growth boom of the 1960s was helped by increased participation of women in the workforce that was a result of innovation years prior, such as the commercialization of household appliances.
We believe that companies may need many years to fully implement some of the innovations being created today. Take, for example, cloud computing. When companies decide to upgrade their vast legacy systems, they may have to transform their business processes to fully reap the benefits. For instance, some industries are beginning to use supply chain software in the cloud, which enables business partners in multiple parts of the chain to have real-time access to inventories, shipping times, etc. This type of system becomes more valuable as more players in the supply chain participate. As this network effect takes shape, it could dramatically alter business efficiency, but it will take many years for whole supply chains to transition.
Implications of Recognizing Change
We think it is highly likely that government statistics deviate more from reality today than they did a couple of decades ago. The implications are that inflation is likely lower, and real growth and productivity is likely higher, than traditionally believed. This would be more consistent with high margins, rising technology company earnings, and increased R&D spending.
12 If our conclusions are correct, there are important implications for investing:
- Interest rates are likely to stay low as the impact of innovation keeps inflation subdued. Low inflation and interest rates should support equity valuations.
- If innovation is creating solid value for consumers now and into the medium-term, it is positive for the creators and beneficiaries of this change. In periods of intense change, growth stocks should do particularly well. Stocks that appear cheap may simply be victims of change and innovation.
- From a sector perspective, technology companies are disrupting the way we buy things, pay for goods and services, consume media, and more. Companies that facilitate e-commerce or benefit from the shift to online advertising could be big beneficiaries of these changes.
- The Consumer Discretionary sector should benefit from increased consumption due to lower quality-adjusted pricing. Mobile phones that serve as navigation aides, encyclopedias, and cameras are just one example of products where intense feature improvement leads to better value for consumers and frees up money to be spent on other goods and services. For example, increased free time should continue to support higher spending; time spent on leisure and sports, as well as the share of spending on those activities, has increased over the past several years in the U.S.
Alger Recognizes and Capitalizes on Change
At Alger, we focus on change and look for innovation because we believe that is where we can find the best opportunities. Our analysts follow an investment process to remove pre-existing biases that helps them focus solely on the facts in order to obtain an independent view. We believe that advances across a wide range of industries are alive and well. We see significant innovation by American companies, which is attractive to our analysts and, ultimately, bodes well for U.S. consumers, investors, and the companies benefitting from that change.
View the PDF