Log In
Alger
  • About Alger
    • Our History
      Our Investment Approach
      Investment Team
      Careers
      Commitment to Sustainability
      Commitment to Culture & Employees
      Charitable Giving
      We Remember
  • Strategies
    • Strategies Overview
      Asset Classes
      Vehicles
      Strategy Finder
      Large Cap
      Mid Cap
      Small/SMid Cap
      International
      Alternatives
      Specialty
      Focus
      Mutual Funds
      ETFs
      Interval Funds
      SMAs
      Institutional Separate Accounts
      UCITS
      Collective Investment Trusts
  • Insights
    • Insights
      Blogs
      Alger On the Money
      Alger On the Record
      Manager Commentary
      Capital Markets Outlook
      Retirement Solutions
      Viewpoints
      The Power of Focus
  • Newsroom
    Press ReleasesIn the News
  • Contact Us
Part Two in the Innovation Series
.st0 { fill: #999999; } Explore Insights .st0 { fill: #999999; } Subscribe to Emails .st0 { fill: #999999; } .st0 { fill: #999999; } Download PDF

The Enduring Force of Innovation​

Brad Neuman's Photo

Brad Neuman, CFA;

Senior Vice President
Director of Market Strategy

Our research shows that innovation is a force that transcends crises and calamities, driving technological advancement forward at a powerful, exponential rate.

Our research shows that innovation is a force that transcends crises and calamities, driving technological advancement forward at a powerful, exponential rate. We find that the most innovative companies ultimately produce stronger fundamentals and stock returns. Given its critical influence, we believe that innovation is an enduring force that holds the key to progress and investment performance.


A Bright Idea

Light has always been critical to society but the relative cost of an hour of luminescence has declined significantly over time.1 An hour of work in 1750 BC would have paid for the equivalent of less than a couple of minutes of light from a sesame oil lamp. In 1800 one could afford a little more than 10 minutes of light with the income from an hour of work. However, by 1880, an hour of work would purchase over four hours of light from a kerosene lamp. As productivity roared on, by 1950, one could buy over 500 hours of light provided by a conventional filament bulb using the income from an hour of work, and today an hour of work provides for over 19,000 hours of light from an LED bulb.2 Measured in terms of light, productivity has increased over 5% annually, 100,000-fold, in a little more than two centuries, thanks to innovation (see Figure 1).

The incredible force of innovation and its associated increased productivity, or output per hour, pushes corporate earnings and GDP forward over time, despite economic downturns and market panics. While investors have many concerns in the current economic environment, ranging from where we are in the economic cycle to what actions global central banks will take, the answers to these concerns do not drive long-term corporate earnings growth—innovation does. Our research shows:
  • Technological progress is a powerful and relatively consistent engine of exponential growth3
  • Productivity and innovation drive the economy and earnings over time, despite volatility in economic cycles
  • Innovation creates change and opportunity as new business processes, products, or services are born

Innovation and Productivity Throughout Time

It is easy to lose perspective of just how much progress humankind has made. Writing was invented about 5,000 years ago, democracy 2,500 years ago, the scientific method about 500 years ago, electric power less than 220 years ago, the World Wide Web only 30 years ago, the sequencing of the human genome less than 20 years ago, and smartphones in roughly the last 15 years.

In spite of this awe inspiring progress, many people still have concerns about the recent seemingly subpar productivity data. However, we have previously written that the government statistics understate productivity (“The Impact of Innovation Deflation”). A better way to evaluate productivity may be to move away from those statistics and focus more on their underlying driver: innovation and technological advancement.
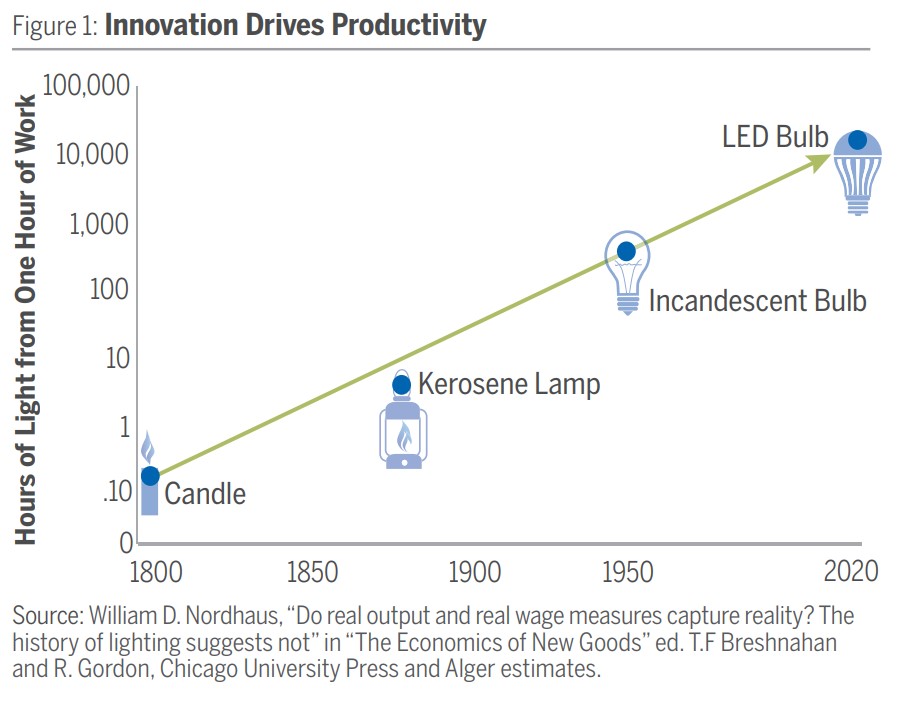
Figure 1 chart
​​ We see two important insights when we study technological progress in many different industries. First, advances occur at an exponential rate, which means the rate of change is accelerating, creating a potent engine to drive the economy forward. Second, improvement occurs relatively consistently over time, linking seemingly independent inventions to a powerful upward trend. These observations give us confidence in the bigger picture of growth through innovation without having to predict the next invention or becoming overly concerned with the ebb and flow of economic cycles.

For example, MIT researchers have found when technologies are analyzed in terms of functions, such as computational speed, rather than specific innovations, such as the integrated circuit, the rate of exponential growth has been relatively consistent over time.4 As illustrated in Figure 2 below, the development of ever cheaper processing has continued at an exponential rate from electromechanical computers built with levers and gears, to computers utilizing vacuum tubes, to the advent of the transistor to switch electronic signals, and finally to integrated circuits containing the equivalent of billions of transistors at a fraction of the cost. In other words, while computing technologies have come and gone, the amount of processing power that one dollar could purchase has grown at a relatively consistent exponential rate over more than 100 years. If this growth continues into the future, affordable computers could reach the processing power of the human brain in about 30 years. The MIT researchers found that this functional growth through various inventions is evident not only in computing but in information storage (e.g., hard drives) as well as information transportation (e.g., fiber optic cables). Similarly, we saw this same trend at work in the illumination innovations detailed earlier.
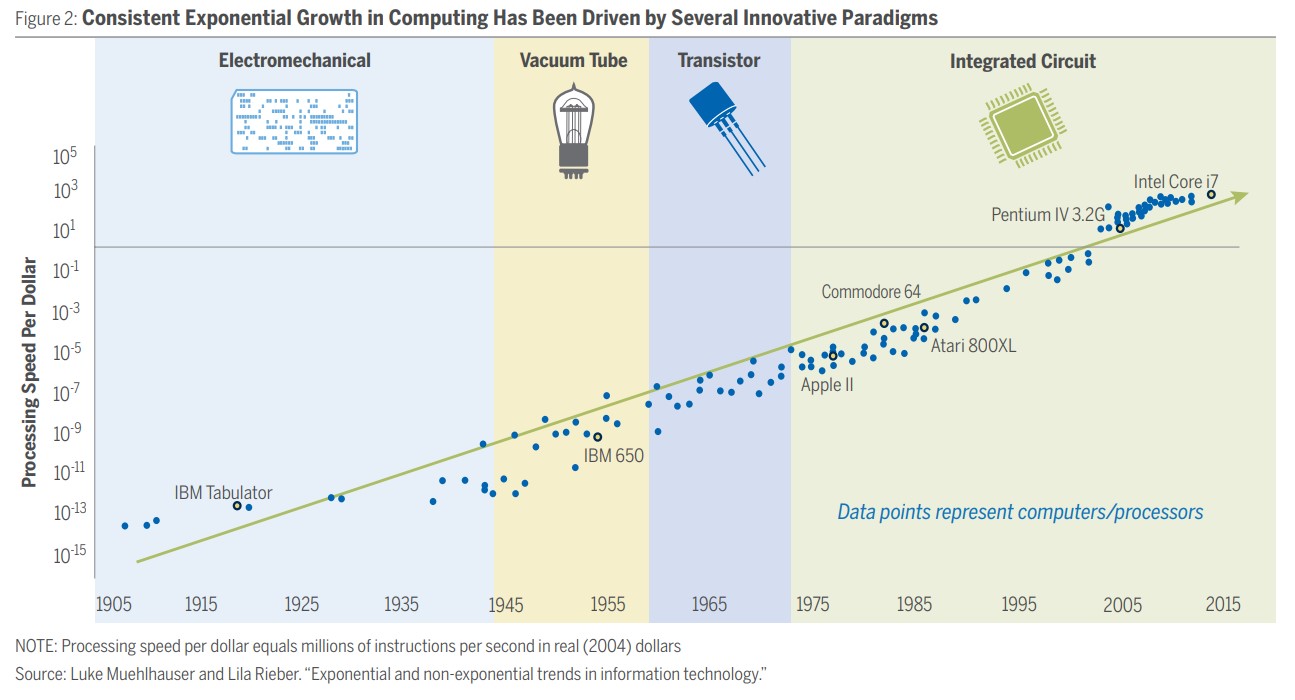
Figure 2 chart

Innovation Adoption Throughout Economic Cycles

History shows that innovation does not stop during difficult economic times. People and corporations continue to generate new ideas to improve productivity even as the economy contracts. In fact, patent applications grew in all of the recent past recessions.5

It isn’t just ideas that fight through tough economies. Actual productivity progresses as well. The three-year period from the second quarter of 2008 through the second quarter of 2011 was a very challenging time for the U.S. economy in that real GDP was essentially flat and the unemployment rate increased to 9.1%. However, the stock market posted double-digit gains over this time frame, S&P 500 earnings rose 13%, and productivity increased more than 6%. This demonstrates that despite the volatility of economic cycles, productivity typically marches forward, boosting profits and ultimately stock prices.

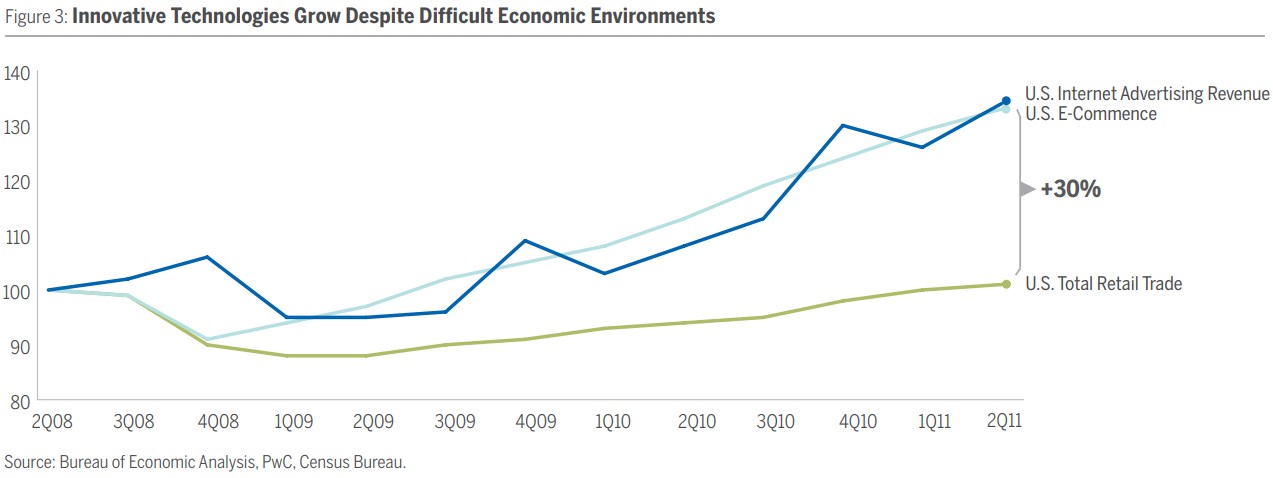
Productivity does not just occur on its own, however. It is the result of innovation, and as such, it is important to examine the adoption of new technologies despite economic downturns. During the difficult economic environment of 2008-2011, internet-related businesses grew strongly with e-commerce and internet advertising increasing over 30% (see Figure 3). This growth was driven by adoption of the underlying internet technologies as internet hosts increased approximately 50%, smartphone ownership more than tripled, and wireless and broadband penetration both rose.6,7,8,9

Figure 3 chart
​Indeed, we see this same pattern of productivity-enhancing technologies increasing their penetration in the face of weak economies throughout time and across the world. Panics, recessions, and essentially flat GDP in the mid-to-late 1870s didn’t prevent a double-digit increase in the productivity-enhancing railroad expansion in the U.S. Similarly, telegraph usage and steamship tonnage grew in the U.S. throughout four separate recessions or panics in the late 19th century. Even in the Great Depression, automobile ownership was able to grow when traditional goods and services were not. In more modern times, radio and air traffic both grew through many recessions in the U.S and the U.K. in the mid-20th Century, and internet traffic grew in the U.S. and globally through the Global Financial Crisis.10,11

The lesson here is twofold. First, on an aggregate level, we believe productivity and innovation are the most important medium-and long-term drivers of corporate earnings growth, not economic cycles or central banks. Second, within the economy, innovation creates change and opportunity as new business processes, products, services, or whole industries are born and flourish from innovation, regardless of the ups and downs of the economy.

Implications for Investors

Our work suggests that growth through innovation has been extremely powerful and relatively consistent throughout various economic cycles. It is innovation that drives corporate earnings over time. Therefore, we believe investors should focus on innovation rather than economic cycles and media headlines.

Figuring out where innovation is headed means deeply understanding new technologies and their impact on consumers and businesses, which we believe may lead to strong investment performance. Some examples of innovation that will potentially impact companies and stock prices going forward include the:
  • Increase of cloud computing and its impact on IT operations
  • Growth of e-commerce and its effect on the retail landscape
  • Progress toward autonomous vehicles and their potential to reshape automobile manufacturers and supply chains
  • Impact of changing consumer behavior owing to the growth of the mobile internet
  • Revolutionary progress in treating patients with immunotherapy and biopharmaceutical drugs
We believe that the most innovative companies, which may be defined as those companies with a high ratio of annual R&D investment to revenue, are best positioned to take advantage of these and other important trends that we have identified. Our view is supported by our own experience over decades of investment management as well as academic studies, which have concluded that the most innovative companies have higher “future market share, future sales growth, and future return on assets” as well as significantly higher excess stock returns.12

That is why we have focused on concentrating our original, bottom-up, fundamental research on the leading edge of innovation and change for more than 55 years. Our global analysts leverage this expertise to find new and exciting innovations that are generating change and opportunity.


View the PDF​​



Recommended Insights for You:


1 Here we are referring to 1,000 lumen-hours. A lumen-hour is a unit of luminous energy, equal to that produced in one hour by a light source emitting one lumen, a unit of measurement of visible light, approximately equal to the amount of light cast by a candle at one foot.
2 William D. Nordhaus, “Do real output and real wage measures capture reality? The history of lighting suggests not,” in “The Economics of New Goods” ed. T.F Breshnahan and R. Gordon, Chicago University Press and Alger estimates.
3 Note that consistent exponential growth implies that the underlying rate of change is accelerating i.e. in each period, the absolute increase in units is larger than the prior period.
4 Heebyung Koh and Christopher L. Magee, “A functional approach for studying technological progress: Application to information technology,” Technological Forecasting & Social Change 73, 2006.
5 Total U.S. patent applications grew in 2008, 1990, and the early 1980s according to the U.S. Patent and Trademark Office, http://www.uspto.gov/web/offices/ac/ido/oeip/taf/us_stat.htm
6 A host is a domain name that has an IP address record associated with it. “Internet Doman Survey,” July 2011, Internet Systems Consortium, http://ftp.isc.org/www/survey/reports/2011/07/
7 “2012 Mobile Future in Focus,” ComScore.
8 The World Bank, http://data.worldbank.org.
9 Aaron Smith, “Home Broadband 2010,” Pew Research Center, August 2010.
10 Comin, D. and Hohijn B., “Cross-Country Technological Adoption: Making the Theories Face the Facts”. Journal of Monetary Economics, January 2004, pp. 39-83.
11 “Visual Networking Index,” Cisco Systems.
12 Baruch Lev, Suresh Radhakrishnan, Mustafa Ciftci, “The Stock Market Valuation of R&D Leaders,” March 2006. Baruch Lev, Suresh Radhakrishnan, Mustafa Ciftci, “The Stock Market Valuation of R&D Leaders,” March 2006. See also Ashiq Ali, Mustafa Ciftci and William M. Cready, “Market Underestimation of the Implications of R&D Increases for Future Earnings: The US Evidence.” Journal of Business Finance & Accounting, April/May 2012.


The views expressed are the views of Fred Alger Management, LLC (“FAM”) and its affiliates as of November 2021. These views are subject to change at any time and may not represent the views of all portfolio management teams. These views should not be interpreted as a guarantee of the future performance of the markets, any security or any funds managed by FAM. These views are not meant to provide investment advice and should not be considered a recommendation to purchase or sell securities.

Risk Disclosures: Investing in the stock market involves risks, including the potential loss of principal. Growth stocks may be more volatile than other stocks as their prices tend to be higher in relation to their companies’ earnings and may be more sensitive to market, political, and economic developments. Local, regional or global events such as war, acts of terrorism, the spread of infectious illness such as COVID-19 or other public health issues, recessions, or other events could have a significant impact on investments. Past performance is not indicative of future performance. Investors whose reference currency differs from that in which the underlying assets are invested may be subject to exchange rate movements that alter the value of their investments.

Investing in innovation is not without risk and there is no guarantee that investments in research and development will result in a company gaining market share or achieving enhanced revenue. Companies exploring new technologies may face regulatory, political or legal challenges that may adversely impact their competitive positioning and financial prospects. Also, developing technologies to displace older technologies or create new markets may not in fact do so, and there may be sector-specific risks as well. As is the case with any industry, there will be winners and losers that emerge and investors therefore need to conduct a significant amount of due diligence on individual companies to assess these risks and opportunities.

Important Information for US Investors: This material must be accompanied by the most recent fund fact sheet(s) if used in connection with the sale of mutual fund or ETF shares. Fred Alger & Company, LLC serves as distributor of the Alger mutual funds.

Important Information for UK and EU Investors: This material is directed at investment professionals and qualified investors (as defined by MiFID/FCA regulations). It is for information purposes only and has been prepared and is made available for the benefit investors. This material does not constitute an offer or solicitation to any person in any jurisdiction in which it is not authorised or permitted, or to anyone who would be an unlawful recipient, and is only intended for use by original recipients and addressees. The original recipient is solely responsible for any actions in further distributing this material and should be satisfied in doing so that there is no breach of local legislation or regulation.

Certain products may be subject to restrictions with regard to certain persons or in certain countries under national regulations applicable to such persons or countries.

Alger Management, Ltd. (company house number 8634056, domiciled at 78 Brook Street, London W1K 5EF, UK) is authorised and regulated by the Financial Conduct Authority, for the distribution of regulated financial products and services. FAM and/or Weatherbie Capital, LLC, U.S. registered investment advisors, serve as sub-portfolio manager to financial products distributed by Alger Management, Ltd.

Alger Group Holdings, LLC (parent company of FAM and Alger Management, Ltd.), FAM, and Fred Alger & Company, LLC are not an authorized persons for the purposes of the Financial Services and Markets Act 2000 of the United Kingdom (“FSMA”) and this material has not been approved by an authorized person for the purposes of Section 21(2)(b) of the FSMA.

Important information for Investors in Israel: This material is provided in Israel only to investors of the type listed in the first schedule of the Securities Law, 1968 (the “Securities Law”) and the Regulation of Investment Advice, Investment Marketing and Investment Portfolio Management Law, 1995. The Fund units will not be sold to investors who are not of the type listed in the first schedule of the Securities Law.

Fred Alger Management, LLC 100 Pearl Street, 27th Floor, New York, NY 10004 / www.alger.com / 800.992.3863 (Retail) / 800.223.3810 (Institutional)

ENDFORE1121
​

RecommendedContent Title

ETF Investors

This ETF is different from traditional ETFs.

Traditional ETFs tell the public what assets they hold each day. This ETF will not. This may create additional risks for your investment. Specifically:

You may have to pay more money to trade the ETF’s shares. This ETF will provide less information to traders, who tend to charge more for trades when they have less information.

The price you pay to buy ETF shares on an exchange may not match the value of the ETF’s portfolio. The same is true when you sell shares. These price differences may be greater for this ETF compared to other ETFs because it provides less information to traders.

These additional risks may be even greater in bad or uncertain market conditions.

The differences between this ETF and other ETFs may also have advantages. By keeping certain information about the ETF confidential, this ETF may face less risk that other traders can predict or copy its investment strategy. This may improve the ETF’s performance. If other traders are able to copy or predict the ETF’s investment strategy, however, this may hurt the ETF’s performance. For additional information regarding the unique attributes and risks of this ETF, please refer to the prospectus.

ABOUT ALGER

  • Our History
  • Our Investment Approach
  • Investment Team
  • Careers
  • Charitable Giving
  • We Remember
  • Documents & Forms
  • Fund Literature
  • FAQs

ESG

  • Commitment to Sustainability
  • Alger's Approach to ESG Investing and Oversight
  • Weatherbie’s Approach to ESG Investing and Oversight
  • Redwood's Approach to Responsible Investing
  • Commitment to Culture & Employees

ASSET CLASSES

  • Large Cap
  • Mid Cap
  • Small/SMid Cap
  • International
  • Alternatives
  • Specialty
  • Focus

VEHICLES

  • Mutual Funds
  • ETFs
  • Interval Funds
  • SMAs
  • Institutional Separate Accounts
  • UCITS
  • Collective Investment Trusts

TOOLS

  • Strategy Finder
  • 10 Year Estimator
  • Quarterly Expense Estimator

INSIGHTS

  • Featured Insights
  • Capital Markets Outlook
  • Alger On the Money
  • Alger On the Record
  • The Alger Podcast
  • Search All Insights

NEWSROOM

  • Press Releases
  • In the News

LITERATURE

  • Mutual Funds
  • SMAs
  • Institutional Separate Accounts
  • UCITS

CONTACT US

  • All Inquiries

LEGAL NOTICES

  • Proxy Information
  • 2026 Estimated Dividends & Distribution Information
  • Sales Charges
  • Customer Relationship Summaries
  • UK Investor Report
  • Form ADVs
  • Interval Fund Repurchasing Schedule
View Mobile Site

Copyright Alger All Rights Reserved Privacy Policy Business Continuity Terms and Conditions
youtube channel LinkedIn Instagram