Log In
Alger
  • About Alger
    • Our History
      Our Investment Approach
      Investment Team
      Careers
      Commitment to Sustainability
      Commitment to Culture & Employees
      Charitable Giving
      We Remember
  • Strategies
    • Strategies Overview
      Asset Classes
      Vehicles
      Strategy Finder
      Think Further For Retirement
      Large Cap
      Mid Cap
      Small/SMid Cap
      International
      Alternatives
      Specialty
      Focus
      Mutual Funds
      ETFs
      SMAs
      Institutional Separate Accounts
      UCITS
      Collective Investment Trusts
  • Insights
    • Insights
      Blogs
      Alger On the Money
      Alger On the Record
      Manager Commentary
      Capital Markets Outlook
      Retirement Solutions
      Viewpoints
      The Power of Focus
  • Newsroom
    Press ReleasesIn the News
  • Contact Us
A Global Rebalanceof Capital-Friendliness
.st0 { fill: #999999; } Explore Insights .st0 { fill: #999999; } Subscribe to Emails .st0 { fill: #999999; } .st0 { fill: #999999; } Download PDF

A Global Rebalance of Capital-Friendliness

Michael Mufson Photo

Michael J. Mufson, CFA;

Co-Founder
Chief Investment Officer, Portfolio Manager
Redwood Investments, LLC

Ezra Samet Photo

Ezra Samet, CFA;

Senior Vice President
Portfolio Manager, Senior Analyst
Redwood Investments, LLC

Donald Smith Photo

Donald W. Smith, CFA;

Senior Vice President
Portfolio Manager, Senior Analyst
Redwood Investments, LLC

Alexi Makkas photo

Alexi Makkas;

Senior Vice President
Portfolio Manager, Senior Analyst
Redwood Investments, LLC

We believe it is time to overcome the psychological inertia of U.S. exceptionalism, reevaluate traditional investment frameworks, and capitalize decisively on the compelling, yet underappreciated opportunities now unfolding in international equities.

​​​​​​

Since the 2008 Great Financial Crisis (GFC), the United States has been the world’s most capital-friendly market: the combination of significant monetary and fiscal stimulus, deep capital markets, predictable policymaking, strong adherence to and enforcement of contract law, accommodative labor policy, and reasonable regulation has attracted capital, fueled innovation, and supported premium valuation multiples. This trend also supported the U.S. dollar (USD), as non-U.S. investors deployed substantial amounts of capital into U.S. markets, creating both demand for USD and selling pressure on their local currencies.

Viewed through this same lens, we believe a consequential shift is now taking place outside the United States. The catalysts for this shift are both 1) local political change, with more than 70 national elections in 2024 and record voter participation, and 2) mounting geopolitical strains. Across Europe and Asia, governments are now lowering structural impediments to capital growth, stimulating their economies with fiscal and monetary policy, cutting taxes, streamlining listing requirements, and strengthening corporate governance to drive shareholder value. We believe these actions should spark meaningful investment and unlock new drivers of economic and capital markets growth, just as secular growth engines like energy independence, grid modernization, and artificial intelligence (AI) begin to take off. ​

​ ​ Despite these tailwinds, international equities still trade at some of the deepest valuation discounts relative to the U.S. we’ve seen this century. In our view, the disconnect between structurally improving fundamentals and subdued valuations creates an attractive environment for active equity investors. In this piece, we make the case for investing in international equities, focusing on three key drivers:

​ I. Structural Policy Reforms Are Turning Pro-Growth and Support Profitability: International markets are undergoing a meaningful shift from austerity toward growth-oriented policy and significant capital-market reforms.

​ II. Emerging Thematic Opportunities Offer Unique Growth Potential: Innovation and technology adoption outside the U.S. are propelling entire industries but remain underappreciated by global investors.
​
​III. ​Why it Pays to Go Active: The average active international equity manager has historically outperformed passive investing internationally by exploiting persistent and measurable market inefficiencies.


I. Structural Policy Reforms Are Turning Pro-Growth and Support Profitability​

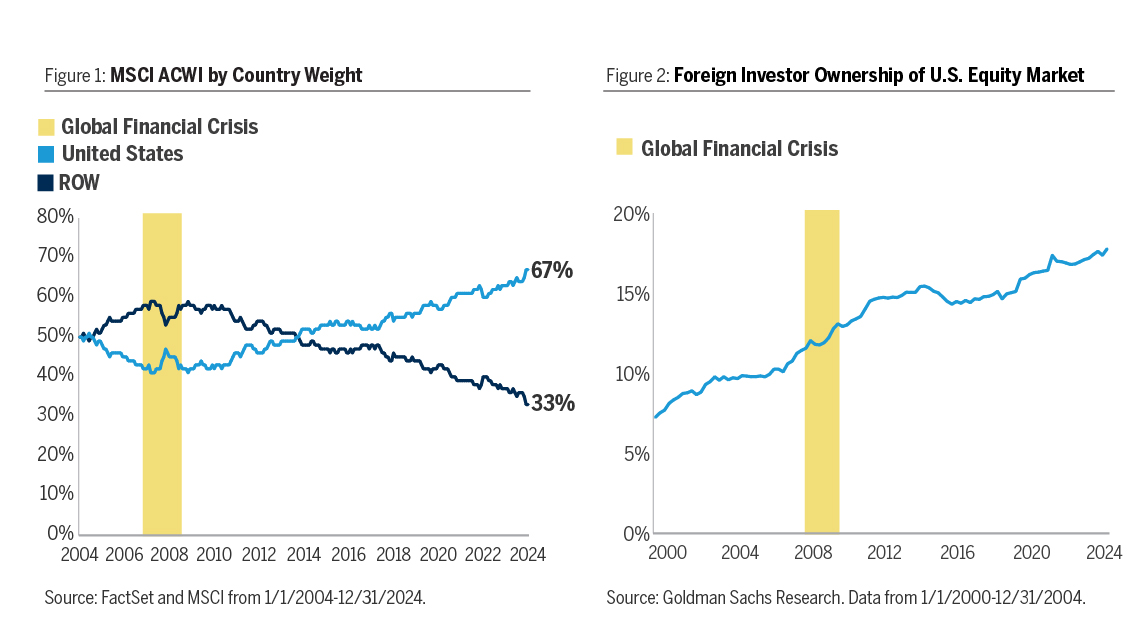
​​ For much of the period following the GFC, the United States enjoyed a deeply entrenched, capital-friendly environment—anchored in efficient capital markets, strong shareholder-oriented governance, a vibrant entrepreneurial culture, low corporate taxes, and innovation-supportive regulation. By contrast, many international economies paired fiscal austerity and higher tax burdens with excessive regulation (e.g., stringent labor laws and costly data-privacy compliance), inadvertently curbing private investment, innovation, and corporate earnings growth. As a result, these last two decades of U.S. outperformance have re-shaped global indices: the United States accounted for approximately 67% of the MSCI All Country World Index’s (ACWI) market value by year-end 2024, up from 42% in 2008 (see Figure 1). Moreover, foreign investor ownership of U.S. equities has increased steadily from 11% at the end of 2007, to 18% in 2024 (see Figure 2). Clearly, investor portfolios have become increasingly U.S.-centric since the GFC; however, the structural pro-growth policies discussed below may be the catalyst to reverse this trend going forward.

Figure 1 shows MSCI ACWI by Country Weight. And Figure 2 shows Foreign Investor Ownership of U.S. Equity Market

Fiscal Policy Pivots from Austerity to Stimulus: Following the wave of national elections in 2024, governments across Europe, Asia, and Latin America are abandoning post-GFC fiscal austerity and embracing growth-oriented budgets, taking cues from the United States, where deficit-financed investments have delivered superior GDP and equity returns. For instance, Germany has agreed to relax its constitutional “debt brake,” a fiscal rule that traditionally capped its federal budget deficit at 0.35% of GDP—giving the government more room for targeted spending. It also plans to invest €500 billion over the next decade in grid modernization, defense, and digital infrastructure, and offer tax incentives to attract startups and venture capital funding. Japan has matched the pivot with a record ¥115 trillion (~$770 billion) stimulus for automation and capital expenditures (CapEx). China has raised its deficit target to roughly 4% of GDP and is issuing special bonds to fund power infrastructure and advanced manufacturing. India’s 2025 budget allocates ₹11.1 trillion (3.4% of GDP) to roads, rail, and digital connectivity alongside production incentives. Within Latin America, Brazil’s “Novo PAC” channels R$1.7 trillion (~$300 billion) into transportation and energy infrastructure through 2029, while Mexico pairs tax breaks with large shipping port and near-shoring investments. The shared objective: reignite economic growth and corporate earnings.

Monetary Policy Turns Supportive: With inflation moderating throughout the world, central banks in the Euro area, the U.K., China, and several Emerging Markets have begun cutting interest rates, while the Bank of Japan has adopted unprecedented flexibility, allowing yields to settle at levels that still promote credit growth. As of May 31, 2025, among the central banks that implemented rate cuts during the past year are the European Central Bank, the U.K., India, China, Mexico, Korea, and Australia. Importantly, lower real rates reduce the hurdle for investment and should ease the funding cost disadvantage relative to the United States that has long plagued international companies. Meanwhile, persistent U.S. inflation and the Federal Reserve’s (Fed) restrictive monetary policy stance has left U.S. real rates elevated. Paradoxically, a weakening USD from mounting fiscal and trade policy uncertainty could potentially provide an additional tailwind for international equities.

Capital-Market Reforms Unlock Shareholder Value: Across the globe, capital-market reforms are widening access to financing and rewarding shareholders. Japan may be the benchmark for effective corporate governance improvement as the Tokyo Stock Exchange (TSE) reforms push companies to unwind cross-shareholdings and focus on efficient capital deployment—strategic mergers and acquisitions (M&A), research and development (R&D), corporate spin-offs, and return of excess cash to shareholders via buybacks and dividends. In Europe, the Capital Markets Union reboot is under way: Germany’s 2023 Future Financing Act makes it easier for start-ups and small-to-medium sized enterprises (SMEs) to raise capital; France’s Tibi 2 channels institutional money into late-stage technology and health care companies; and Spain is rolling out a flexible initial public offering (IPO) framework and OECD-backed measures to deepen investor participation. Within the emerging markets, China is expanding its registration-based IPO system, easing buyback rules and tightening delisting standards; South Korea’s Corporate Value-Up program couples tax breaks with mandatory value-enhancement plans; India has introduced near-real-time settlement and simplified IPO disclosures; and Saudi Arabia’s Tadawul now permits full foreign ownership and offers new derivatives, broadening sources of capital. In our view, these initiatives are essential to accelerate corporate earnings growth, as they attract global capital, enhance corporate efficiency, and reinforce the foundation for long-term shareholder value creation.

II. Emerging Thematic Opportunities Offer Unique Growth Potential ​

​​​ The U.S. has been the epicenter of corporate growth and innovation for decades, making significant contributions to the personal computer, internet, and smartphone, and potentially leading the world in AI given its momentum in hardware and software development. However, this does not mean that all great growth companies are based in the U.S. In Table 1, we highlight a number of high-growth, secular themes that we believe offer attractive long-term opportunities—and that remain under-represented in most U.S. indices. ​

​Table 1: S​ecular Growth Opportunities Unique to International Equities
​E-Commerce and Fintech
​Online shopping is still far less common in India, Southeast Asia, and Latin America than in the United States. Yet rapid smartphone adoption and better logistics give local e-commerce champions a strong tailwind—and a clear path to branch into high-margin financial-services offerings.
​Neo-Banking and Digital Financial Services
​Underbanked populations and real-time payments reforms are enabling fintechs and progressive banks in Europe, Africa, and emerging Asia to leapfrog legacy infrastructure, and unlock low-cost customer acquisition and fee-based revenue growth.
​Energy and Power Infrastructure
​Europe’s push for energy independence and grid modernization mandates, and Asia’s AI boom are catalyzing multi-year investment cycles, positioning international utilities, turbine, and power-equipment suppliers for strong, policy-backed earnings growth.
​E.U. Aerospace & Defense
​Geopolitical re-armament, air-traffic recovery, and supply-chain reshoring are lifting non-U.S. defense budgets and commercial aircraft demand, benefiting European aerospace & defense contractors and diversified international suppliers with high barriers to entry.
​European  Construction Boom 
​The E.U. has set aside approximately €1.4 trillion for grid and infrastructure upgrades through 2040, creating long-term demand for builders, engineers, and project managers, while a post-war Ukraine could add another €500 billion in reconstruction work, according to the IMF.
​Semiconductor Manufacturing & Equipment
​Global chip-capacity expansion, especially in Asia and Europe via policy incentives, secures long-cycle revenue for international foundries and the specialized toolmakers that supply them. Taiwanese and Korean manufacturers have taken the lead from U.S.-based suppliers of cutting-edge chips.
​Biopharma
Manufacturing

​Global pharmaceutical companies are increasingly outsourcing drug and vaccine production to Europe and emerging Asia, providing international Contract Development and Manufacturing Organizations (CDMOs) with potentially significant volume growth and margin improvement. Meanwhile, recent acquisitions of U.S.-based CDMOs have reduced available manufacturing capacity within the U.S.
​Super Apps
​A super app is a single mobile platform that combines messaging, payments, commerce, and other everyday services to create a powerful digital ecosystem that boosts user engagement and revenue through network effects. In our view, international markets with limited brick-and-mortar retail, high cash usage, and large unbanked populations offer ideal conditions for super-app development. 
​Addressing M​yopia and Vision Technology​
​According to the American Academy of Ophthalmology, myopia—or nearsightedness—will rise from 40% of the global population, roughly 3.2 billion people today, to 60% by 2050. Additionally, we believe the gradual integration of connected glasses (i.e., internet connectivity) with AI and audiological technology may have a substantial total addressable market. ​


National-Interest Investment Amplifies Growth Opportunities: Beyond energy independence, Russia’s invasion of Ukraine also exposed the scale of Europe’s under-investment in defense. Since 2022, NATO countries outside the U.S. have added over €150 billion to annual defense budgets, and most are legislating multi-year outlays to reach or exceed the 2%-of-GDP target—fueling demand for aerospace, cybersecurity, and other dual-use technologies. At the same time, governments worldwide now treat advanced compute and AI infrastructure as critical assets, steering capital toward domestic chip fabrication, cloud capacity, and AI-software ecosystems rather than relying solely on U.S. or Chinese platforms. Together, we believe these energy, defense, and technology priorities embed long-duration spending into national frameworks, and create powerful secular tailwinds for companies that enable sovereign security in both the physical and digital realms.

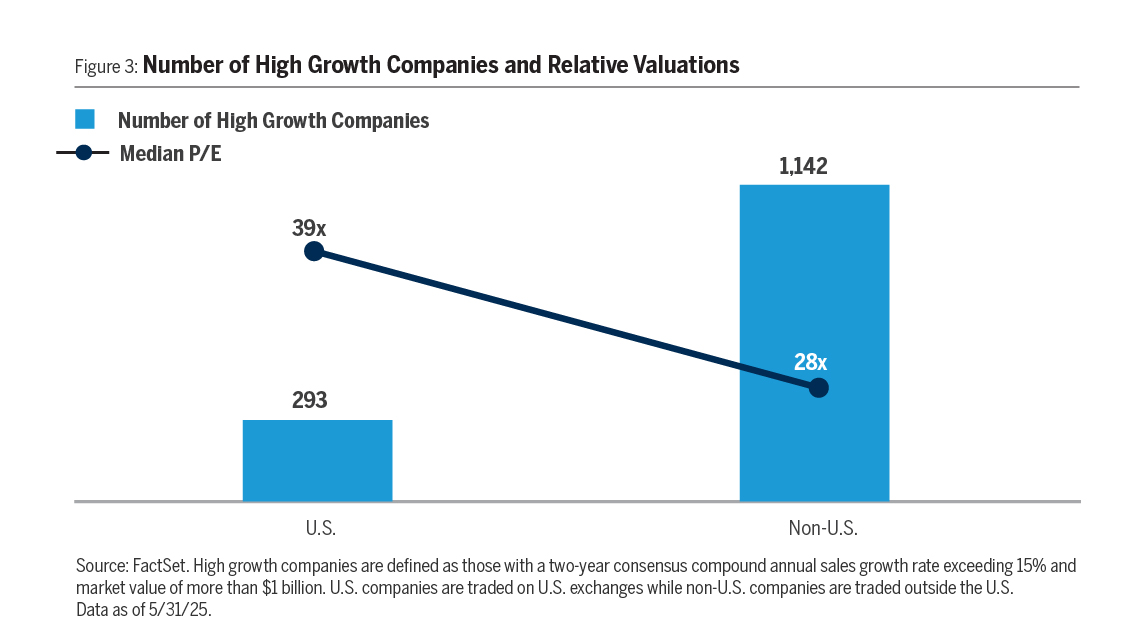
International Growth Stocks at Lower Valuation Multiples: The previously discussed themes are only a fraction of the opportunities outside the U.S. In fact, there are nearly four times as many high-growth companies–defined as those with two-year consensus sales growth exceeding 15% annually—trading outside the U.S. as there are within (see Figure 3). Moreover, valuations for high-growth stocks outside the U.S. appear quite attractive, with a median price-to-earnings ratio that is 28% lower than their U.S. peers.
Number of High Growth Companies and Relative Valuations
Attractive Valuations Amplify Opportunities: 
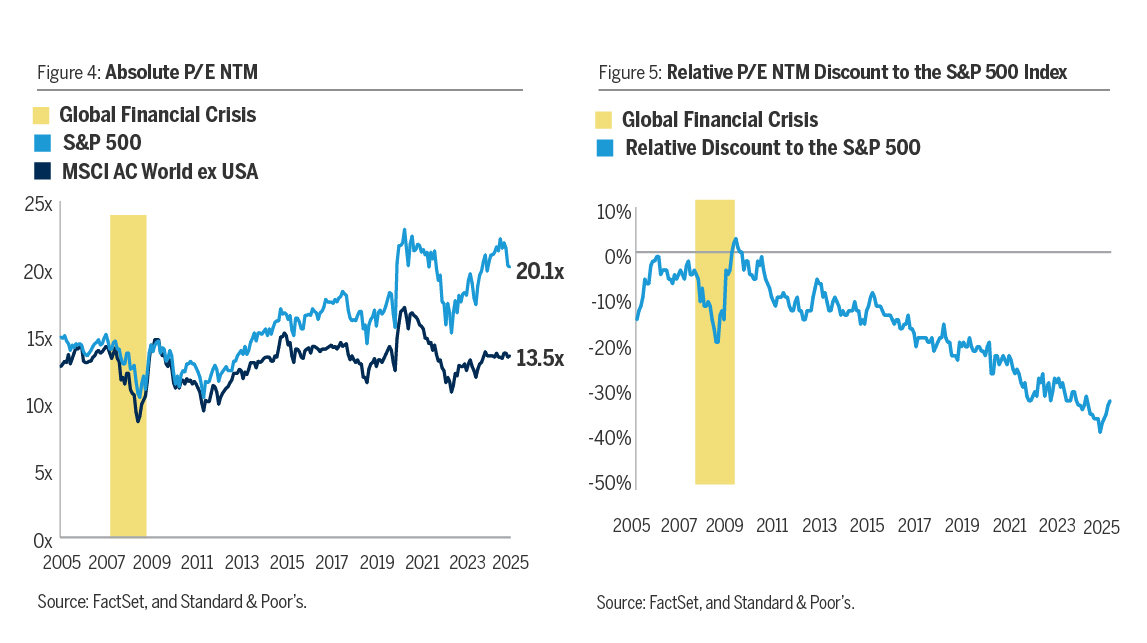
An investment case built on policy reforms and improving growth prospects outside the U.S. is enhanced by attractive valuations: today’s international equity valuations offer some of the widest historical discounts relative to the U.S. (see Figures 4 and 5).
Figure 4: Absolute P/E NTM. Figure 5: Relative P/E NTM Discount to the S&P 500 Index
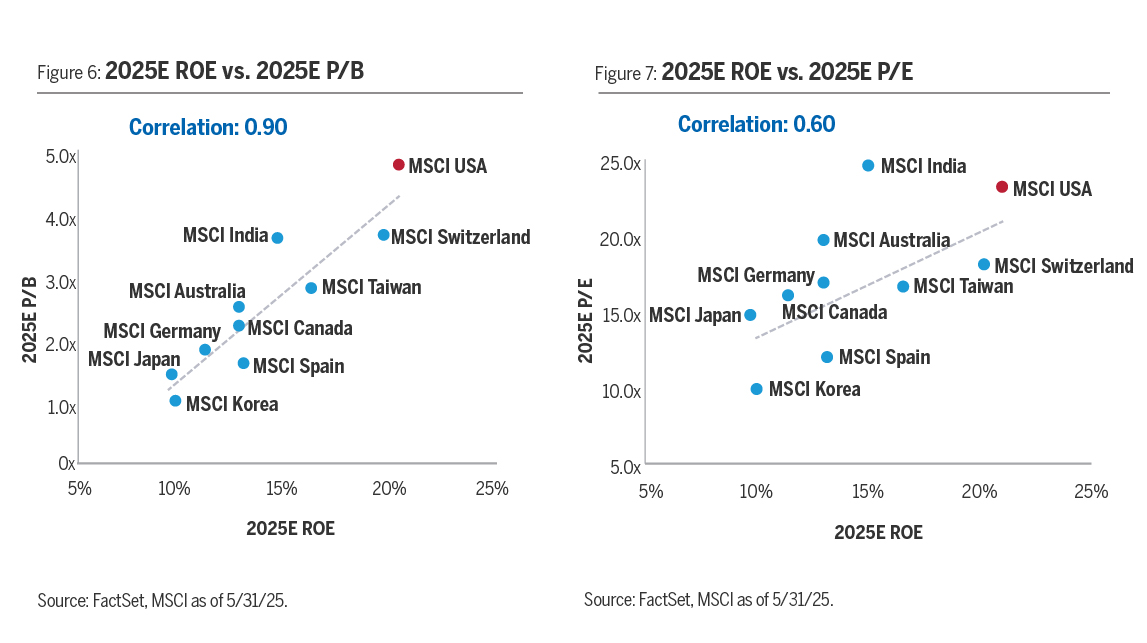
In our view, the relative valuation gap versus the U.S. may begin to narrow as pro-growth policies and capital market reforms outside the United States could drive stronger corporate earnings growth, and potentially stronger returns. For example, Figures 6 and 7 highlight the strong correlation between profitability, measured by return on equity (ROE), and valuations, using both price-to-book (P/B) and (P/E) ratios. In both figures, the red dot representing the MSCI USA Index has the highest ROE relative to other countries, which helps explain the relative valuation premium. As capital efficiency improves, and corporate earnings growth accelerates globally—as observed in the U.S. since the GFC—we believe ROEs across international equity markets should trend higher. Given the strong historical correlation between profitability and valuations, we believe that rising ROEs in international markets should support correspondingly higher valuation multiples.
Figure 6: 2025E ROE vs. 2025E P/B. Figure 7: 2025E ROE vs. 2025E P/E
In summary, allocating to international equities today is about accessing structurally improving markets with attractively-valued growth stocks. Increasingly capital friendly geographies represent an emerging source of compounding earnings growth, rising returns, and improving valuations. For these reasons, we believe that international equities may provide attractive and competitive returns relative to the U.S. for the first time since the GFC.

III. Why It Pays to Go Active​

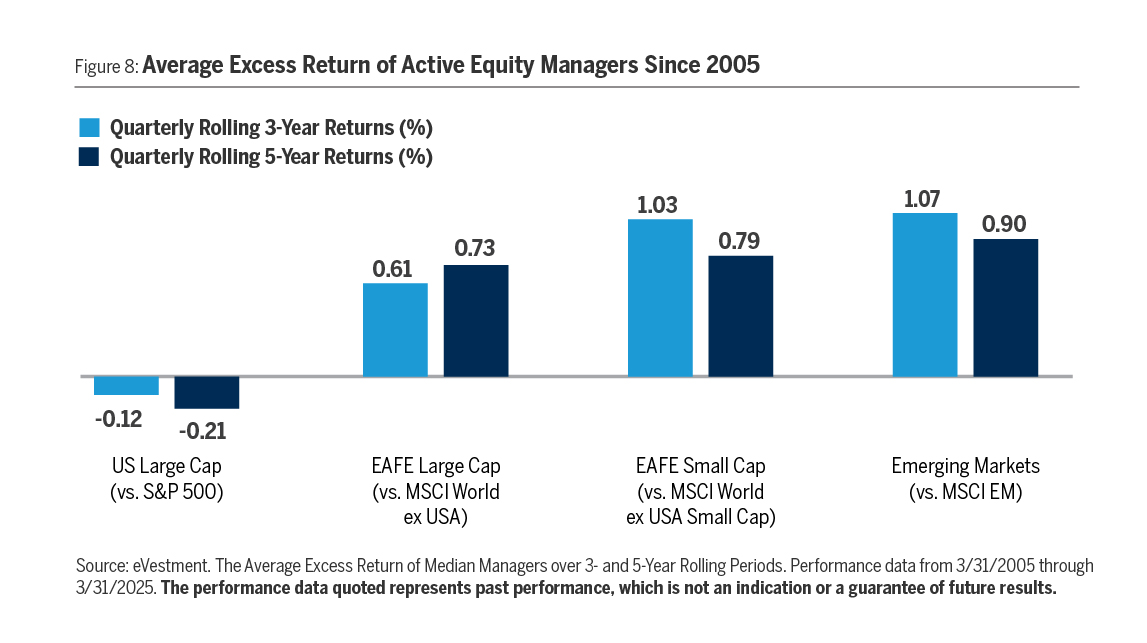
​​ While U.S. passive index funds have dominated headlines in recent years—largely due to their low fees and the relative difficulty active managers face in generating excess returns—active management in international equity markets appears far more compelling. Over the past two decades, the average excess return of active managers within international markets has been significantly higher than the U.S. as measured over rolling three- and five-year periods, where the edge is even greater in international small cap and emerging markets (see Figure 8). At the same time, passive international index funds typically charge three to ten times the average expense ratio of an S&P 500 fund, reflecting the added complexity, lower scale, and inefficiency of non-U.S. equity markets. As a result, fees on passive international products sit close to those of active funds. Given this narrow cost gap and the demonstrably higher alpha opportunity available in less-efficient international markets, we believe that paying a modest premium for skilled active management is sensible—the potential outperformance could more than offset the incremental fee over the long-term.
Average Excess Return of Active Equity Managers Since 2005
We believe that one of the primary reasons international and emerging market active managers have generated higher excess performance is a higher level of market inefficiency in ex-U.S. equity markets relative to the U.S. In simple terms, market inefficiency occurs when a security’s price deviates from its true economic value because of information delays, investor psychology or trading frictions. These mispricings create opportunities for disciplined investors to buy undervalued shares or sell overvalued ones. If a market is highly efficient, then the opportunities to buy mispriced assets are scarce, and active managers will likely find it hard to consistently generate alpha. Conversely, highly inefficient markets provide more opportunities for active managers and can make outperformance more feasible.

Taking this one step further, we measure the inefficiency of an equity market with five inputs: 1) number of stocks in the universe, 2) average number of sell-side analysts per stock, 3) level of institutional ownership, 4) frequency of consensus forecast error, and 5) average magnitude of forecast error. Combined, we believe these factors highlight areas where attentive, informed investors can more readily identify attractive investments that others have missed. Based on this definition, international and emerging equity markets demonstrate, on average, higher levels of inefficiency. We believe this helps explain why the average international active manager has historically generated higher excess returns than the average U.S. manager.

The Redwood Investment Framework: Within the broad active investment management space, we believe our approach may be particularly well-suited to non-U.S. markets. While monitoring the global economic backdrop is important for investors, the Redwood investment team primarily focuses on conducting bottom-up fundamental analysis to identify companies with the ability to compound their earnings meaningfully faster than the consensus expectations. We conduct our own due diligence, spending most of our time 1) independently forecasting multi-year earnings growth and 2) evaluating the quality of the business. We then assess the valuation for each individual company based on our independent multi-year earnings forecasts.

1) Misforecasted Earnings Growth: Sell-side forecasts tend to miss their mark, especially when predicting earnings over longer periods. The further analysts try to forecast into the future, the greater their errors tend to be, creating opportunities to invest in companies whose true multi-year earnings potential is underestimated. By constructing our investment team, philosophy, process, and incentive structure appropriately, we can escape the “gravitational pull” of consensus and arrive at independent forecasts of multi-year earnings.

2) Quality: Investors often focus heavily on short-term performance, overlooking great companies with strong long-term growth potential. “Quality” companies, in our view, have a durable competitive advantage, skilled management teams that effectively utilize these strengths, and solid financial health to execute their strategy. In addition to being resilient, such companies typically achieve better-than-average financial outcomes, such as high return on invested capital, strong profit margins, and stable balance sheets. Our experience has found that focusing on quality often leads us to higher levels of conviction in our differentiated view of earnings.The Top Two Quintiles of Earnings Revisions & Quality Companies Have Historically Outperformed

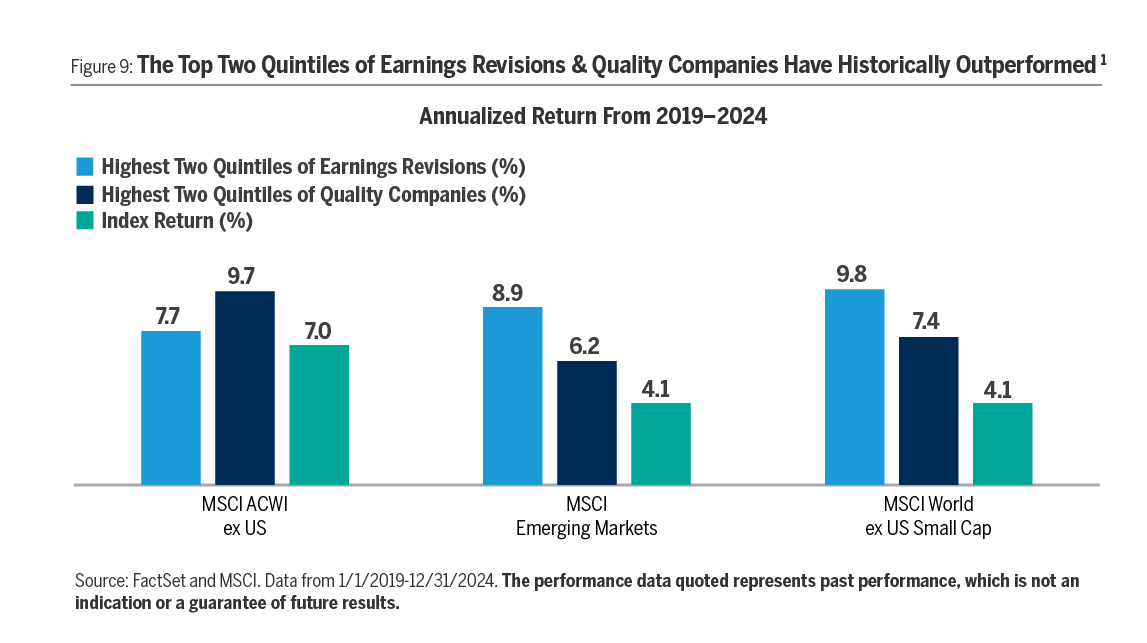
We believe that combining our emphasis on quality businesses with a search for misforecasted earnings growth serves as a reliable investment framework in identifying and owning companies that can compound their earnings faster than the market expects over the medium-to-long term. To validate mis-forecasted earnings and quality as persistent sources of alpha, in Figure 9, we quantify the performance of the two highest quintiles by the quality and earnings revisions factor within the MSCI ACWI ex U.S., MSCI World ex U.S. Small Cap and MSCI Emerging Markets Index. As shown in the chart, the top two quintiles of companies by quality and earnings revision factors outperformed their respective benchmarks over the past five years.
​
As demonstrated, active management has historically outperformed passive indexing in international and emerging equity markets due to higher market inefficiency. Redwood’s investment approach emphasizes bottom-up fundamental analysis, specifically targeting high-quality businesses with durable competitive advantages and underappreciated earnings growth potential.
​ ​

Going Forward​

​​​​In short, while the era of U.S. exceptionalism has been undeniably rewarding for investors since the 2008 GFC, we believe it is prudent to challenge existing assumptions and recognize the pivotal shift in capital friendliness unfolding internationally. The economic momentum the U.S. has enjoyed since the GFC may be slowing amidst growing policy uncertainty, which may remove the strong USD headwinds that hindered international equity performance. Concurrently, the era of capital-friendliness, previously dominated by the United States, is rapidly expanding globally. Structural reforms from Europe to Asia are fostering pro-investment environments by streamlining regulation, stimulating fiscal spending, and encouraging corporate efficiency—key ingredients for unlocking shareholder value. Additionally, powerful secular growth trends in technology, infrastructure, energy, and defense offer compelling opportunities, often overlooked and significantly discounted relative to their U.S. counterparts. In our view, for the first time in many years these conditions present an actionable moment for prudent investors to actively consider portfolio allocation toward international equities. Further, disciplined active managers, adept at identifying high-quality companies poised for robust, underestimated earnings growth, may be uniquely positioned to leverage this global rotation. We believe it is time to overcome the psychological inertia of U.S. exceptionalism, reevaluate traditional investment frameworks, and capitalize decisively on the compelling, yet underappreciated opportunities now unfolding in international equities.

​
​

Recommended Insights for You:

​​
1 Methodology for Calculating Earnings Revision and Quality Factor Portfolio Returns: Redwood utilizes a proprietary ranking system called the “Redwood Spotlight,” which ranks each security within the given universe on a series of factors that each receive a customized weight. The total factor library is ~55 factors, but each security is ranked on ~20-25 of the most impactful factors discovered through back-testing. The factors are divided into 3 categories (or “super-factors”): (1) Estimate Revisions, (2) Quality, and (3) Valuation. The output of the Redwood Spotlight is a daily overall rank of 1 (best)—5 (worst) for each security in the universe. The Redwood Spotlight also outputs discreet ranks for each super-factor (Estimate Revisions, Quality, and Valuation) to provide transparency to users who can extract more insight from the analysis. These super-factor ranks (also 1-5) indicate the sources of strength or weakness of a given security’s overall rank. They also allow us to analyze historical performance of relevant equity asset classes grouped by these ranks. The referenced analysis was conducted using the Estimate Revision and Quality super-factors as individual factors. The universe was grouped individually by the Estimate Revision rank and the Quality rank. We rebalanced the universe monthly and measured the trailing 5 year return of each se¬curity. This allowed us to isolate stocks which ranked 1 and 2 on both super-factors and measure their trailing 5 year performance relative to the index.


The views expressed are the views of Fred Alger Management, LLC (“FAM”) and its affiliates as of June 2025. These views are subject to change at any time and may not represent the views of all portfolio management teams. These views should not be interpreted as a guarantee of the future performance of the markets, any security or any funds managed by FAM. These views are not meant to provide investment advice and should not be considered a recommendation to purchase or sell securities. Holdings and sector allocations are subject to change.

Risk Disclosures: Investing in the stock market involves risks, including the potential loss of principal. Growth stocks may be more volatile than other stocks as their prices tend to be higher in relation to their companies’ earnings and may be more sensitive to market, political, and economic developments. Foreign securities, Frontier Markets, and Emerging Markets involve special risks including currency fluctuations, inefficient trading, political and economic instability, and increased volatility. Past performance is not indicative of future performance. Investors whose reference currency differs from that in which the underlying assets are invested may be subject to exchange rate movements that alter the value of their investments. Companies involved in, or exposed to, AI-related businesses may have limited product lines, markets, financial resources or personnel as they face intense competition and potentially rapid product obsolescence, and many depend significantly on retaining and growing their consumer base. These companies may be substantially exposed to the market and business risks of other industries or sectors, and may be adversely affected by negative developments impacting those companies, industries or sectors, as well as by loss or impairment of intellectual property rights or misappropriation of their technology. Companies that utilize AI could face reputational harm, competitive harm, and legal liability, and/or an adverse effect on business operations as content, analyses, or recommendations that AI applications produce may be deficient, inaccurate, biased, misleading or incomplete, may lead to errors, and may be used in negligent or criminal ways. AI companies, especially smaller companies, tend to be more volatile than companies that do not rely heavily on technology. Investing in innovation is not without risk and there is no guarantee that investments in research and development will result in a company gaining market share or achieving enhanced revenue. Companies exploring new technologies may face regulatory, political or legal challenges that may adversely impact their competitive positioning and financial prospects. Developing technologies to displace older technologies or create new markets may not in fact do so, and there may be sector-specific risks. There will be winners and losers that emerge, and investors need to conduct a significant amount of due diligence on individual companies to assess these risks and opportunities.

Fred Alger Management, LLC uses the Global Industry Classification Standard (GICS®) for categorizing companies into sectors and industries. GICS® is used for all portfolio characteristics involving sector and industry data such as benchmark, active and relative weights and attribution. The Global Industry Classification Standard (GICS®) is the exclusive intellectual property of MSCI Inc. (MSCI) and Standard & Poor’s Financial Services, LLC (S&P). Neither MSCI, S&P, their affiliates, nor any of their third party providers (“GICS Parties”) makes any representations or warranties, express or implied, with respect to GICS or the results to be obtained by the use thereof, and expressly disclaim all warranties, including warranties of accuracy, completeness, merchantability and fitness for a particular purpose. The GICS Parties shall not have any liability for any direct, indirect, special, punitive, consequential or any other damages (including lost profits) even if notified of such damages. Sector and industry classifications are sourced from GICS. Historical classifications use GICS categories available as of the date of this presentation.

Important Information for US Investors: This material must be accompanied by the most recent fund fact sheet(s) if used in connection with the sale of mutual fund and ETF shares. Fred Alger & Company, LLC serves as distributor of the Alger mutual funds.

Important Information for UK and EU Investors: This material is directed at investment professionals and qualified investors (as defined by MiFID/FCA regulations). It is for information purposes only and has been prepared and is made available for the benefit investors. This material does not constitute an offer or solicitation to any person in any jurisdiction in which it is not authorised or permitted, or to anyone who would be an unlawful recipient, and is only intended for use by original recipients and addressees. The original recipient is solely responsible for any actions in further distributing this material and should be satisfied in doing so that there is no breach of local legislation or regulation. Certain products may be subject to restrictions with regard to certain persons or in certain countries under national regulations applicable to such persons or countries.

Alger Management, Ltd. (company house number 8634056, domiciled at 85 Gresham Street, Suite 308, London EC2V 7NQ, UK) is authorised and regulated by the Financial Conduct Authority, for the distribution of regulated financial products and services. FAM, Weatherbie Capital, LLC, and/or Redwood Investments, LLC, U.S. registered investment advisors, serve as sub-portfolio manager to financial products distributed by Alger Management, Ltd.

Alger Group Holdings, LLC (parent company of FAM and Alger Management, Ltd.), FAM, and Fred Alger & Company, LLC are not an authorized persons for the purposes of the Financial Services and Markets Act 2000 of the United Kingdom (“FSMA”) and this material has not been approved by an authorized person for the purposes of Section 21(2)(b) of the FSMA.

Important information for Investors in Israel: Fred Alger Management, LLC is neither licensed nor insured under the Israeli Regulation of Investment Advice, of Investment Marketing, and of Portfolio Management Law, 1995 (the “Investment Advice Law”). This document is for information purposes only and should not be construed as an offering of Investment Advisory, Investment Marketing or Portfolio Management services (As defined in the Investment Advice Law). Services regulated under the Investment Advice Law are only available to investors that fall within the First Schedule of Investment Advice Law (“Qualified Clients”). It is hereby noted that with respect to Qualified Clients, Fred Alger Management, LLC is not obliged to comply with the following requirements of the Investment Advice Law: (1) ensuring the compatibility of service to the needs of client; (2) engaging in a written agreement with the client, the content of which is as described in section 13 of the Investment Advice Law; (3) providing the client with appropriate disclosure regarding all matters that are material to a proposed transaction or to the advice given; (4) a prohibition on preferring certain Securities or other Financial Assets; (5) providing disclosure about “extraordinary risks” entailed in a transaction (and obtaining the client’s approval of such transactions, if applicable); (6) a prohibition on making Portfolio Management fees conditional upon profits or number of trans- actions; (7) maintaining records of advisory/discretionary actions. This document is directed at and intended for Qualified Clients only.

This presentation is for information purposes only and should not be construed as an offering of Investment Advisory, Investment Marketing or Portfolio Management services (As defined in the Investment Advice Law). Services regulated under the Investment Ad- vice Law are only available to investors that fall within the First Schedule of Investment Advice Law (“Qualified Clients”).

It is hereby noted that with respect to Qualified Clients, Fred Alger Management, LLC is not obliged to comply with the following requirements of the Investment Advice Law:

(1) ensuring the compatibility of service to the needs of client; (2) engaging in a written agreement with the client, the content of which is as described in section 13 of the Investment Advice Law; (3) providing the client with appropriate disclosure regarding all matters that are material to a proposed transaction or to the advice given; (4) a prohibition on preferring certain Securities or other Financial Assets; (5) providing disclosure about “extraordinary risks” entailed in a transaction (and obtaining the client’s approval of such transactions, if applicable); (6) a prohibition on making Portfolio Management fees conditional upon profits or number of transactions; (7) maintaining records of advisory/discretionary actions. This presentation is directed at and intended for Qualified Clients only.

Important Information for Investors in Australia:​ This document is provided to prospective investors and, by receiving it, each prospective investor is deemed to represent and warrant that it is a “Wholesale Client” (as those terms are defined in Australian Corporations Act 2001 (Cth) (Act)).

Fred Alger Management, LLC is exempt from the requirement to hold an Australian financial services licence under the Corporations Act (as a result of the operation of ASIC Class Order 03/1100 as amended by the ASIC Corporations (Repeal and Transitional) Instrument 2016/396 and extended by ASIC Corporations (Amendment) Instrument 2023/588) in respect of the financial services it provides to wholesale clients in Australia and is regulated by the Securities and Exchange Commission under United States laws which differ from Australian laws.

Important Information for Investors in Brunei: Fred Alger Management, LLC does not have a capital market service license under the Securities Market Order 2013 to provide investment advice to clients in, or to undertake investment business in, Brunei.

By requesting or accepting financial services or financial product information from [The Manager], you agree, represent and warrant that you are engaging our services or in receipt of information wholly outside Brunei and, as applicable, subject to the foreign laws of the contract governing the terms of our engagement.

This document does not constitute an offer or an advertisement within the meaning of the Securities Market Order 2013 and shall not be distributed or circulated to any person in Brunei other than the intended recipient.

Important Information for Investors in Hong Kong: Fred Alger Management, LLC does not carry on a business in a regulated activity in Hong Kong and is not licensed by the Securities and Futures Commission.

This document is issued for information purposes only. It is not to be construed as an offer or solicitation for the purchase or sale of any financial instruments. It has not been reviewed by the Securities and Futures Commission.

Fred Alger Management, LLC accepts no liability whatsoever for any direct, indirect or consequential loss arising from or in connection with any use of, or reliance on, this document which does not have any regard to the particular needs of any person. Fred Alger Management, LLC takes no responsibility whatsoever for any use, reliance or reference by persons other than the intended recipient of this document.

Any prices referred to herein are indicative only and dependent upon market conditions. Past performance is not indicative of future results. Unless otherwise specified, investments are not bank deposits or other obligations of a bank, and the repayment of principal is not insured or guaranteed. They are subject to investment risks, including the possibility that the value of any investment (and income derived thereof (if any)) can increase, decrease or in some cases, be entirely lost and investors may not get back the amount originally invested. The contents of this document have not been reviewed by any regulatory authority in the countries in which it is distributed.

The opinions and views herein do not take into account your individual circumstances, objectives, or needs and are not intended to be recommendations of particular financial instruments or strategies to you. This marketing document does not identify all the risks (direct or indirect) or other considerations which might be material to you when entering any financial transaction. You are advised to exercise caution in relation to any information in this document. If you are in doubt about any of the contents of this document, you should seek independent professional advice.

Important Information for Investors in Taiwan: The Manager is not licensed to engage in an investment management or investment advisory business in Taiwan and the services described herein are not permitted to be provided in Taiwan. However, such services may be provided outside Taiwan to Taiwan resident clients.

Important Information for Investors in India: The strategies offered have not been registered with the Securities and Exchange Board of India (“SEBI) or any other regulatory or governmental authority in India and no such authority has confirmed the accuracy or determined the adequacy of this document.

This document does not constitute an offer to sell or a solicitation of an offer to buy the strategies from any person other than Fred Alger Management, LLC, and subscription of the strategies shall not be accepted from a person to whom this document has not been addressed or sent by the Fred Alger Management, LLC. This document is not and should not be considered as a Prospectus. The strategies are not being offered for sale or sub- scription but are being privately placed with a limited number of investors. Prospective investors must seek legal advice as to whether they are entitled to subscribe for or purchase the strategies being offered and comply with all relevant Indian laws in this respect. Any offer or its acceptance is subject to compliance in India with applicable Indian law. None of the Fred Alger Management, LLC, their officers, employees [or affiliates] are expected to be registered with any regulatory or governmental authority in India in respect to their respective roles or functions in relation to the strategies.

Important Information for Investors in Singapore: Fred Alger Management, LLC is not registered with or licensed by the Monetary Authority of Singapore under the Securities and Futures Act 2001 or the Financial Advisers Act 2001, and accordingly, is not purporting to conduct any business activity for which licensing or registration is required in Singapore.

You acknowledge and agree that you have approached Fred Alger Management, LLC at your initiative and that any requests that may be made by you for information on any product or service are unsolicited. Nothing in this document shall be construed as an offer to sell or the solicitation of the sale of or an offer to purchase any product or to engage any service by Fred Alger Management, LLC referred to or discussed in this document. This information contained in this document is for informational purposes only, and was prepared without regard to the specific investment objectives, financial situation or particular needs of any particular person. Nothing in this document constitutes investment, legal, accounting, tax or other advice nor a representation that any product, service, investment or investment strategy is suitable for any recipient of this document. No legally binding terms are created herein or shall be created until definitive documentation is executed and delivered in accordance with any applicable law.

The recipients of this document are required to maintain the confidentiality of the information contained herein. Under no circumstances may this document and/or its contents be reproduced or redistributed in any format without the prior written approval of Fred Alger Management, LLC.

S&P 500®: An index of large company stocks considered to be representative of the U.S. stock market. The MSCI ACWI captures large and mid cap representation across Developed Markets (DM) and Emerging Markets (EM) countries. The MSCI ACWI ex USA Index captures large and mid cap representation across Developed Markets (DM) countries (excluding the U.S.) and Emerging Markets (EM) countries. The index covers approximately 85% of the global equity opportunity set outside the US. The MSCI Europe Index is a free float-adjusted, market capitalization-weighted index that measures the performance of large- and mid-cap stocks across developed European markets. The MSCI USA Index is a free float-adjusted, market capitalization-weighted index that measures the performance of large- and mid-cap stocks in the United States. The MSCI World Index is a free float-adjusted, market capitalization-weighted index that tracks the performance of large- and mid-cap stocks across 23 developed markets worldwide. The MSCI EAFE Index is designed to represent the performance of large and mid-cap securities across developed markets, including countries in Europe, Australasia and the Far East, excluding the U.S. and Canada. The MSCI Emerging Markets Index captures large and mid cap representation across Emerging Markets (EM) countries. The index covers approximately 85% of the free float-adjusted market capitalization in each country.

The MSCI World ex USA Index captures large and mid cap representation across 22 of 23 Developed Markets (DM) countries (excluding the United States). The index covers approximately 85% of the free float-adjusted market capitalization in each country. The MSCI World ex USA Small Cap Index captures small cap representation across 22 of 23 Developed Markets (DM) countries (excluding the United States). The index covers approximately 14% of the free float-adjusted market capitalization in each country.

MSCI Switzerland Index is a free float-adjusted, market-capitalization–weighted benchmark tracking large- and mid-cap companies that make up roughly 85 % of Switzerland’s equity universe. MSCI Taiwan Index is a free float-adjusted, market-capitalization–weighted benchmark covering large- and mid-cap stocks that account for about 85 % of the Taiwanese equity market. MSCI India Index is a free float-adjusted, market-capitalization–weighted benchmark comprising large- and mid-cap companies representing close to 85 % of India’s listed equities. MSCI Australia Index is a free float-adjusted, market-capitalization–weighted benchmark reflecting large- and mid-cap stocks that collectively represent roughly 85 % of Australia’s equity market. MSCI Canada Index is a free float-adjusted, market-capitalization–weighted benchmark measuring the performance of large- and mid-cap Canadian equities, covering about 85 % of the domestic market. MSCI Spain Index is a free float-adjusted, market-capitalization–weighted benchmark capturing large- and mid-cap Spanish companies that comprise approximately 85 % of Spain’s equity universe. MSCI Germany Index is a free float-adjusted, market-capitalization–weighted benchmark tracking large- and mid-cap German stocks representing around 85 % of the country’s equity market. MSCI Korea Index is a free float-adjusted, market-capitalization–weighted benchmark encompassing large- and mid-cap. South Korean companies that make up about 85 % of the local market. MSCI Japan Index is a free float-adjusted, market-capitalization–weighted benchmark covering large- and mid-cap Japanese equities, representing roughly 85 % of Japan’s investable market. The MSCI United Kingdom Index is designed to measure the performance of the large and mid cap segments of the UK market. The index covers approximately 85% of the free float-adjusted market capitalization in the UK.

S&P 500 Index performance does not reflect deductions for fees or expenses. The S&P indexes are a product of S&P Dow Jones Indices LLC and/or its affiliates and has been licensed for use by Fred Alger Management, LLC and its affiliates. Copyright 2025 S&P Dow Jones Indices LLC, a subsidiary of S&P Global Inc. and/or its affiliates. All rights reserved. Redistribution or reproduction in whole or in part are prohibited without written permission of S&P Dow Jones Indices LLC. S&P® is a registered trademark of Standard & Poor’s Financial Services LLC and Dow Jones® is a registered trademark of Dow Jones Trademark Holdings LLC. Neither S&P Dow Jones Indices LLC, Dow Jones Trademark Holdings LLC, their affiliates nor their third party licensors make any representation or warranty, express or implied, as to the ability of any index to accurately represent the asset class or market sector that it purports to represent and neither S&P Dow Jones Indices LLC, Dow Jones Trademark Holdings LLC, their affiliates nor their third party licensors shall have any liability for any errors, omissions, or interruptions of any index or the data included therein.

The indices presented are provided for illustrative purposes, reflect the reinvestment of dividends and do not assess fees and expenses that would have the effect of reducing returns. Investors cannot invest directly in any index. The index performance does not represent the returns of any portfolio advised by Fred Alger Management, LLC and actual client results might differ materially than the indices shown. Note that past performance is no guarantee of future results. Comparison to a different index might have materially different results than those shown.

Source: MSCI. The MSCI information may only be used for your internal use, may not be reproduced or redisseminated in any form and may not be used as a basis for or a component of any financial instruments or products or indices. None of the MSCI information is intended to constitute investment advice or a recommendation to make (or refrain from making) any kind of investment decision and may not be relied on as such. Historical data and analysis should not be taken as an indication or guarantee of any future performance analysis, forecast or prediction. The MSCI information is provided on an “as is” basis and the user of this information assumes the entire risk of any use made of this information. MSCI, each of its affiliates and each other person involved in or related to compiling, computing or creating any MSCI information (collectively, the “MSCI Parties”) expressly disclaims all warranties (including, without limitation, any warranties of originality, accuracy, completeness, timeliness, non-infringement, merchantability and fitness for a particular purpose) with respect to this information. Without limiting any of the foregoing, in no event shall any MSCI Party have any liability for any direct, indirect, special, incidental, punitive, consequential (including, without limitation, lost profits) or any other damages.

FactSet is an independent source, which Alger believes to be a reliable source. FAM, however, makes no representation that it is complete or accurate.

Earnings per share (EPS) is the portion of a company's earnings or profit allocated to each share of common stock. Return on Equity (ROE) is a profitability ratio that measures how much net income a company generates as a percentage of the shareholders’ equity invested in it. Price-to-Book (P/B) is a valuation metric that compares a company’s current market price per share to its book value per share, indicating how the market values its net assets. Price-to-earnings (P/E) is the ratio for valuing a company that measures its current share price relative to its earnings per share. Correlation is a statistical measure that shows how two variables are related to each other. If two variables are correlated, it means that they tend to move together in some way.

Alger pays compensation to third party marketers to sell various strategies to prospective investors.

Fred Alger & Company, LLC 100 Pearl Street, New York, NY 10004 / 212.806.8800 / www.alger.com

RecommendedContent Title

ETF Investors

This ETF is different from traditional ETFs.

Traditional ETFs tell the public what assets they hold each day. This ETF will not. This may create additional risks for your investment. Specifically:

You may have to pay more money to trade the ETF’s shares. This ETF will provide less information to traders, who tend to charge more for trades when they have less information.

The price you pay to buy ETF shares on an exchange may not match the value of the ETF’s portfolio. The same is true when you sell shares. These price differences may be greater for this ETF compared to other ETFs because it provides less information to traders.

These additional risks may be even greater in bad or uncertain market conditions.

The differences between this ETF and other ETFs may also have advantages. By keeping certain information about the ETF confidential, this ETF may face less risk that other traders can predict or copy its investment strategy. This may improve the ETF’s performance. If other traders are able to copy or predict the ETF’s investment strategy, however, this may hurt the ETF’s performance. For additional information regarding the unique attributes and risks of this ETF, please refer to the prospectus.

ABOUT ALGER

  • Our History
  • Our Investment Approach
  • Investment Team
  • Careers
  • Charitable Giving
  • We Remember
  • Think Further
  • Documents & Forms
  • Fund Literature
  • FAQs

ESG

  • Commitment to Sustainability
  • Alger's Approach to ESG Investing and Oversight
  • Weatherbie’s Approach to ESG Investing and Oversight
  • Redwood's Approach to Responsible Investing
  • Commitment to Culture & Employees

ASSET CLASSES

  • Large Cap
  • Mid Cap
  • Small/SMid Cap
  • International
  • Alternatives
  • Specialty
  • Focus

VEHICLES

  • Mutual Funds
  • ETFs
  • SMAs
  • Institutional Separate Accounts
  • UCITS
  • Collective Investment Trusts

TOOLS

  • Strategy Finder
  • 10 Year Estimator
  • Quarterly Expense Estimator

INSIGHTS

  • Featured Insights
  • Capital Markets Outlook
  • Alger On the Money
  • Alger On the Record
  • The Alger Podcast
  • Think Further for Retirement
  • Search All Insights

NEWSROOM

  • Press Releases
  • In the News

LITERATURE

  • Mutual Funds
  • SMAs
  • Institutional Separate Accounts
  • UCITS

CONTACT US

  • All Inquiries

LEGAL NOTICES

  • Proxy Information
  • 2025 Dividends & Distribution Information
  • Sales Charges
  • Customer Relationship Summaries
  • UK Investor Report
  • Form ADVs
View Mobile Site

Copyright Alger All Rights Reserved Privacy Policy Business Continuity Terms and Conditions
youtube channel LinkedIn Instagram