I. Introduction: The Perception Problem
Small cap stocks are often viewed as lower-quality investments, particularly when evaluated using traditional accounting metrics. Investors cite sustained Generally Accepted Accounting Principles (GAAP) losses, inconsistent profitability, and weak return profiles as evidence of deteriorating fundamentals. But what if these signals are misleading? Beneath the surface, many small cap firms are investing heavily in innovation and building competitive advantages through research and development (R&D), branding, and human capital. The real issue may not be the firms themselves, but the accounting framework used to evaluate them. Traditional financial statements could fail to reflect the economic value of intangible assets. As a result, investors may be systematically underestimating the quality and future potential of small cap companies.
II. The Appearance of Weak Profitability
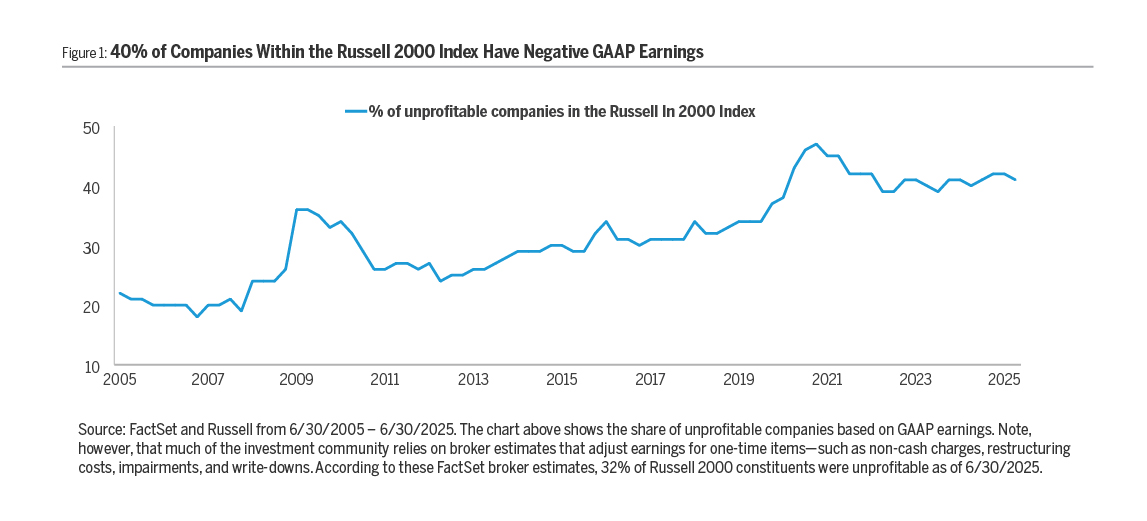
Small cap companies are perceived to be significantly less profitable than their large cap peers. Many large cap indices today contain a majority of consistently profitable companies, while small cap benchmarks lag. Our data suggests that approximately 40% of companies included in the Russell 2000 index are unprofitable on an earnings basis as compared to only 6% of the large cap Russell 1000.
i According to a recent paper entitled
Reassessed Earnings with Capitalized Intangibles, the two smallest quartiles by market capitalization had negative earnings margins while the larger two quartiles were positive. Negative margins indicate these companies spend more to operate than they currently earn in gross profit from sales, at least according to traditional accounting metrics. This apparent fundamental deficiency has led investors to question the competitiveness of small cap businesses.
iiProfitability in the small cap universe also appears to have declined over time. As shown in Figure 1, the proportion of companies with negative earnings has approximately doubled over the past two decades. While this is directionally consistent with the trend in large cap companies as well, the trend in small cap is more profound. This long-term shift has contributed to the perception that small caps are structurally weaker than they once were, both in absolute terms and relative to their large cap peers.
III. The Shift to Intangible Investment
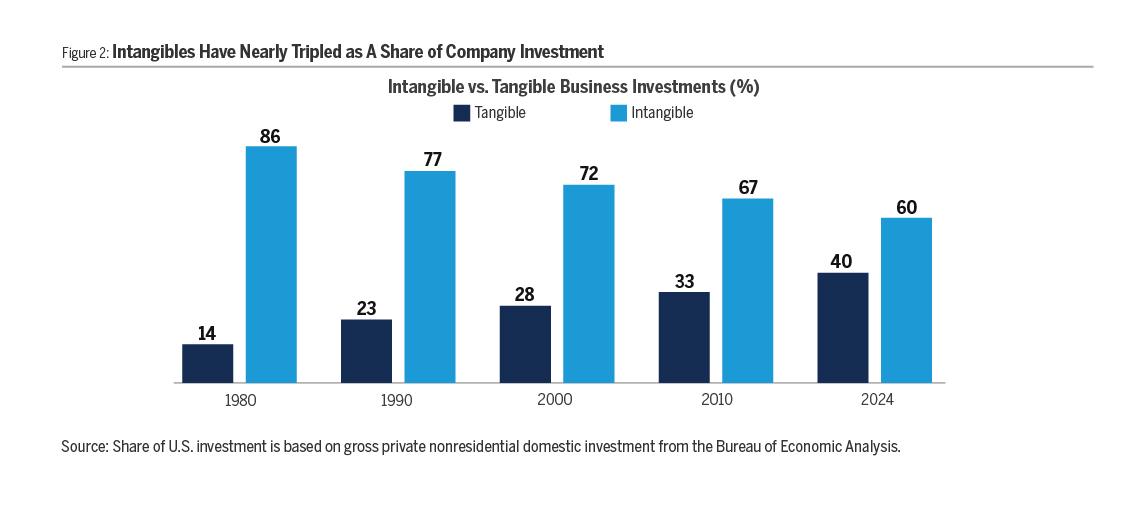
However, the data may not reflect true economic performance. Traditional accounting rules, and particularly GAAP-based earnings, might fail to account for how companiesare increasingly building value through intangible assets—such as R&D, employee training, and brand development. Over the past several decades, the nature of corporate investment has changed dramatically. According to national accounts data, the share of GDP devoted to intangible investment has nearly tripled since 1980, while tangible investment has steadily declined.
iii
Despite their rising importance, accounting rules treat intangible investments very differently from tangible investments. Physical assets like factories or equipment are capitalized and depreciated over time, allowing their cost to be spread across the years in which they contribute value. Intangible investments, by contrast, are typically expensed immediately under GAAP. This means they more significantly reduce current earnings—even when they are long-term investments that build enduring competitive advantage. As intangible intensity rises, this accounting treatment increasingly distorts financial statement metrics, punishing the profitability of firms that invest substantially in intangible assets and creating a misleading picture of firm economics.
For instance, consider NVIDIA which designs semiconductor chips for AI computing. Since its founding in 1993, the company has invested over $60 billion in R&D, and last fiscal year spent more than four times on R&D what it spent on property, plant and equipment (PP&E). Its business is clearly driven by intangible, as opposed to tangible, assets. Yet on its balance sheet, NVIDIA records a larger asset for PP&E than intangible assets; this is not reflective of the economic reality that the company’s hardware designs and software programming model are worth many multiples of its tangible assets. To substantiate this, consider the several trillion dollars of market capitalization that the company commands in the stock market as compared to the more modest net asset value on its balance sheet of only approximately $80 billion—clearly much of its asset value is not being captured by its financial statements.
IV. Intangible Adjustments Yield More Profits
The accounting treatment of intangible investments systematically understates earnings to such an extent that many companies appear unprofitable when they are not—once adjustments are made to treat intangible and tangible assets equivalently. Stated differently, adjusting accounting practices to treat intangible investments similarly to physical assets significantly improves perceived profitability, particularly in small cap companies, given their greater levels of investment relative to their revenue.
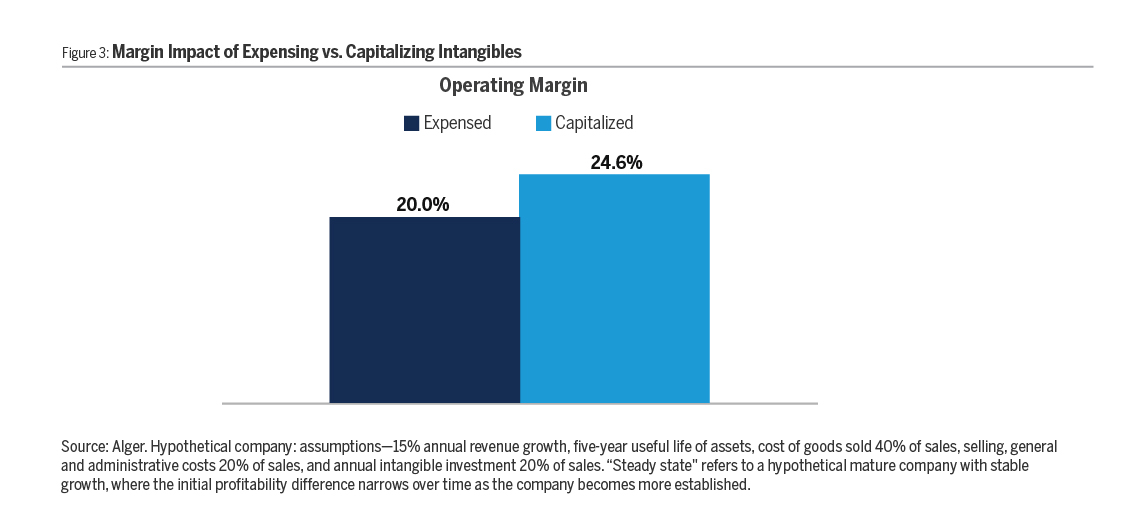
For example, Figure 3 illustrates a fictitious steady-state company growing revenue at 15% annually, with clearly defined costs: non-investment expenses at 60% of sales, and intangible investments (like R&D or branding) at 20% of sales, each asset having a five-year useful life. If these intangible investments are immediately expensed, operating profits appear artificially low due to the immediate hit to earnings. However, by capitalizing these investments— spreading their costs evenly over five years—the upfront expenses decrease, resulting in higher operating profits. The resulting 460 basis point improvement in operating profits underscores how traditional accounting can understate the true profitability of companies heavily investing in intangible assets.
In the study
Reassessed Earnings with Capitalized Intangibles, researchers found that modifying the accounting by capitalizing intangible investment spending partially offset by the amortization of past intangible spending would improve earnings relative to revenue for the universe of companies by nearly 900 basis points (bps). Cash flow from operations relative to revenue would be improved even more—by over 2,400 bps. Here the adjustment is to add back intangible spending (because it is reclassified as cash flow from investing rather than cash flow from operations) with no corresponding amortization expense (because it is non-cash). Interestingly, adjusted earnings relative to revenue appears to have degraded less since the 1990s than reported accounting suggests, while cash flow from operations relative to revenue has actually improved over the past few decades.
iv These effects are particularly pronounced in smaller companies. The smallest quartile of companies by market capitalization would see their earnings relative to revenue improve by over 2,200 bps with this adjustment, more than twice as much as the overall universe of stocks! In fact, 15.8% of the smallest quartile of companies would be reclassified from loss making to profitable as compared to only 4.0% of the largest quartile.
In other words, small caps are not nearly as unprofitable as they are widely believed to be.
V. Reframing Quality: The Impact of Accounting Adjustments
Capitalizing intangible investments doesn’t just improve current profitability metrics—it enhances the overall quality of earnings. Research finds that capitalizing intangible investments better matches expenses with the revenues a company generates, giving investors a clearer view of profitability trends and reinforcing the matching principle in accrual accounting. Specifically, the correlation between contemporaneous expenses and revenues rises after intangible adjustments. The correlation improves the most for the smallest quartile of firms, implying that the misclassification of investmentis greatest in that group of companies, likely because of their less mature cost structure.
v Earnings also become more persistent—a key indicator of earnings quality defined as the degree to which current earnings predict future earnings. This is reflected in the rise of the coefficient on lagged earnings per share (EPS) under the adjusted framework.
vi In other words, the coefficient on lagged EPS tells us how much of last year’s earnings typically carries over into this year—a higher value means profits are more persistent, signaling higher quality earnings.
Finally, adjusted earnings measures better align with stock market outcomes. Firms that have reported losses but are reclassified as profitable under the adjusted approach have historically outperformed those who would continue to report losses after the effect of capitalization by over 1,600 bps on average, according to
Reassessed Earnings with Capitalized Intangibles. These results reinforce the view that GAAP-based profitability metrics can obscure the true economic condition of innovation-oriented firms.
vii Better alignment between expenses and revenues helps investors understand how effectively management is utilizing resources to generate sales and profit growth.
VI. Conclusion: Time to Rethink Small Cap Quality
Traditional accounting significantly understates the quality of small cap companies, in our view. By expensing intangible investments rather than capitalizing them, GAAP metrics systematically reduce reported profitability, weaken measured earnings persistence, and degrade the alignment between expenses and revenues. These distortions not only misrepresent business fundamentals, but also lead to lower stock returns for firms that are in fact investing for long-term growth. While this issue impacts many public companies, small cap firms—which typically invest more heavily in R&D and other intangibles—bear the brunt of this misrepresentation, leading to misleading assessments under current frameworks.
As the economy increasingly relies on innovation and intangible assets, investors who neglect to adjust for these factors may risk overlooking tomorrow’s potential market leaders, particularly in the small cap universe. By capitalizing intangibles and aligning financial analysis with economic reality, we can reveal a clearer picture of where growth, value, and durability truly reside.