Log In
Alger
  • About Alger
    • Our History
      Our Investment Approach
      Investment Team
      Careers
      Commitment to Sustainability
      Commitment to Culture & Employees
      Charitable Giving
      We Remember
  • Strategies
    • Strategies Overview
      Asset Classes
      Vehicles
      Strategy Finder
      Large Cap
      Mid Cap
      Small/SMid Cap
      International
      Alternatives
      Specialty
      Focus
      Mutual Funds
      ETFs
      SMAs
      Institutional Separate Accounts
      UCITS
      Collective Investment Trusts
  • Insights
    • Insights
      Blogs
      Alger On the Money
      Alger On the Record
      Manager Commentary
      Capital Markets Outlook
      Retirement Solutions
      Viewpoints
      The Power of Focus
  • Newsroom
    Press ReleasesIn the News
  • Contact Us
Commentary
.st0 { fill: #999999; } Explore Insights .st0 { fill: #999999; } Subscribe to Emails .st0 { fill: #999999; } .st0 { fill: #999999; } Download PDF

Debunking Private Equity Prestige

Dan Chung's Photo

Dan Chung, CFA;

Chief Executive Officer
Chief Investment Officer
Portfolio Manager

Brad Neuman's Photo

Brad Neuman, CFA;

Senior Vice President
Director of Market Strategy

While private equity is often touted for its high returns, our analysis reveals that private equity may not be as compelling as it is commonly perceived, especially when compared to public equities.

​​​​​​

In recent years, private market investment allocations have soared, with U.S. defined benefit pension funds increasing their allocations to private equity fourfold since 1998.1 According to a BlackRock survey, institutions now allocate, on average, 24% to private markets.2 These allocations are often justified by the robust and diversified returns private equity is perceived to offer over public equities. However, we argue that public growth equities may present a more favorable opportunity due to a number of attributes such as transparency, liquidity, and fees, making them a potentially more attractive asset class compared to private equity, in our view.


Rethinking Private Equity Esteem​

Private equity has been lauded for its strong historical performance relative to public markets. Allocators often cite robust and less correlated returns as reasons for increased allocations. According to PitchBook data, private equity has outperformed public equities consistently.3 However, this perceived advantage warrants careful scrutiny. Private equity internal rates of return (IRR), a measure of annualized performance achieved over the holding period of an investment, are typically compared against returns of public equities. Unfortunately, IRRs are not representative of reality, in our view, as private equity investors must often wait years before their capital is fully deployed (while often paying management fees on total committed capital, including that which has not yet been deployed), which of course is not the case in public equities. One study found that more than half of funds’ IRR can be attributed to timing capital calls (i.e., the process by which a manager asks the investor to contribute a portion of committed capital) and distributions (i.e., the transfer of capital to the investor after the fund exits its position in one of its investments).4 A particularly egregious form of timing manipulation occurs when a private equity fund borrows against investor commitments in order to delay capital calls, thereby increasing the IRR, all else being equal.

Lockups and Liquidity​

While some private equity return data tries to account for the timing of cash flows through so called public market equivalent accounting, where public equity investments are made on the same cadence as the private equity cash flows, that is simply handicapping public equities in our opinion. It may be apples-to-apples, but public equity investors don’t have to tie up their capital and wait to make investments, and they have much fewer liquidity constraints in exiting their investments as well. We question the value of private equity investments with significant illiquidity and durations of 10 years or longer, which is common according to studies and our own experience.5 This may be particularly negative for older investors where access to capital may be necessary for the fulfillment of a rewarding retirement as well as unexpected expenses (both joyous and sad).​

​

Taking a Closer Look at Performance​

To illustrate our point, we looked at cumulative return comparisons between private and public equity. When we examine industry data from PitchBook, we find that the S&P 500 has outperformed cumulative private equity returns in nearly three quarters of the vintages—defined as the year when the initial capital is invested—since 1996. If we look at only the past 20 years, that public equity outperformance increases to 85% and if we look at large cap growth stocks as represented by the Russell 1000 Growth, it rises to 90%. To confirm our analysis, we examined the private equity returns of CalPERS, the largest U.S. public pension fund which now allocates 40% of plan assets to private markets (its private equity allocation is 17%).6 Similarly, we found that both the S&P 500 and Russell 1000 Growth outperformed its private equity investments on a cumulative basis in 90% of the vintages from 2002 through 2021.

Another issue with private equity is that the dispersion in returns between managers is extremely wide. The variance is so large that Mark Anson, CEO of CommonFund, writing in a paper published in the Journal of Portfolio Management called private equity as much of an “access class” as an “asset class.”7 The point is that if you can’t access the “best” performing managers, the returns you experience may be quite a bit lower than the pooled asset returns. The paper showed, using Burgiss data, that median private equity returns over the past 10, 20 and 30 years ending 2021 were 61%, 73% and 83% below pooled returns, respectively. These median buyout private equity funds underperformed the S&P 500 over every time period analyzed, from 5 years to 30 years, ending 2021, by approximately 500-900 basis points (bps) annually (See Figure 1).
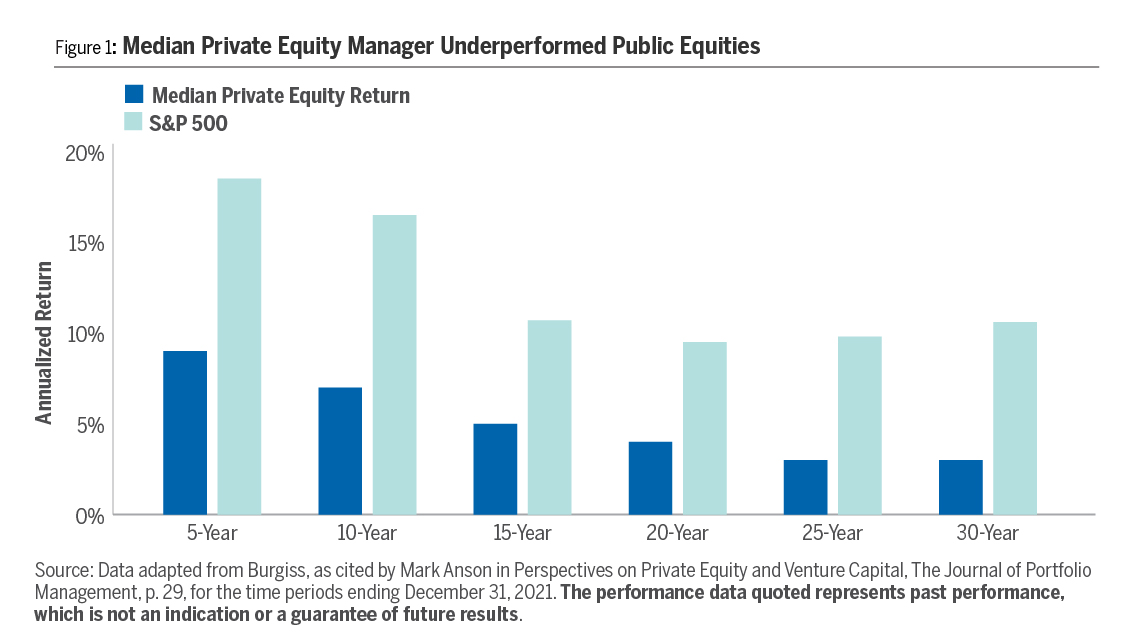
​Figure 1 image shows median private equity manager underperformed public equities

An Illusion Through Leverage​

Further, we believe that the risk and subsequent increased return from high leverage in private equity is not correctly accounted for in many investors’ analysis vis-à-vis stocks. First, private equity risk in terms of volatility is generally smoothed as reported and is significantly higher when adjusted, such that it is actually in-line with large cap public equity indices.8 Second, private equity returns benefit from significantly higher leverage than used in public equities. A paper by Nicolas Rabener in The Journal of Investing is among several studies to show that leveraging small capitalization public equities would replicate the returns of private equity.9 Rabener examined whether a stock portfolio could compete with private equity returns, writing “adding leverage as a factor contributed to high abnormal returns given that interest rates were declining consistently between the 1980s and today [2020] and provided a positive tailwind for the highly leveraged portfolio companies.” Using historical data from PitchBook that shows private equity funds have employed 54% debt with a 5.9% cost of borrowing, we calculate that leverage has contributed over 400bps to private equity annual returns over the past ten years, ending September 30, 2023. With interest rates now significantly higher, private equity returns may decline as less and more expensive debt is employed.

Democratizing Private Equity

Given high minimum investment requirements and long capital commitment periods, investments in private equity have been largely limited to institutional investors. We see that changing. A number of alternative asset managers have identified individual investors as a potential untapped market and have introduced innovative structures and technology solutions to reduce some of the burdens around illiquidity and minimum investment requirements. This increased access has been met with some enthusiasm. Indeed, Bain & Company predicts that private wealth allocations to global alternatives could grow from approximately $4 trillion in 2022 to over $13 trillion by 2032.10​ That said, while new innovations may help improve individual investors’ access to private equity, the vast majority of the category remains in traditional private funds that still have significant shortcomings relative to public equity investing, in our view.

Conclusion

While private equity is often touted for its high returns, our analysis reveals that, after accounting for factors like illiquidity and the timing of cash flows, the dispersion of manager returns and the weak long-term performance of the median manager, private equity may not be as compelling as it is commonly perceived, especially when compared to public equities. Public growth equities, on the other hand, offer greater liquidity, and potentially competitive returns without the burden of complex management fees or the need for extensive capital lock-up periods. Accordingly, we believe these public equity attributes make them an attractive and often overlooked asset class for both individual investors and institutional portfolios.

Given the rapid progression of innovative public companies that can quickly scale up and disrupt industries, coupled with the inherent challenges within private equity, we advocate for a strategic pivot towards public growth equities. In our view, public equities not only mitigate many of the burdens associated with private investments but also capitalize on the rapid innovation and scalability that drive modern economies. ​
​
Therefore, we urge investors to reassess the traditional prestige associated with private equity and to consider the robust, more accessible opportunities available within public markets. By doing so, investors can engage with more flexible, transparent, and responsive investment vehicles that are better suited to the demands of contemporary financial environments and personal investment goals. ​

​

Recommended Insights for You:

1CEM Benchmarking study October 2023, “Asset Allocation and Fund Performance of Defined Benefit Pension Funds in the United States 1998-2021.”
2BlackRock Global Private Markets Survey 2023
3PitchBook Global Benchmarks Q2 2023 Larocque, Shive, and Stevens, “Private Equity Performance and the Effects of Cash-Flow Timing,” The Journal of Portfolio Management,” 2022.
4Larocque, Shive, and Stevens, “Private Equity Performance and the Effects of Cash-Flow Timing,” The Journal of Portfolio Management,” 2022.
5Here we are talking about the experience of the Alger Family as well as studies such as Larocque, Shive, and Stevens, “Private Equity Performance and the Effects of Cash-Flow Timing,” The Journal of Portfolio Management,” 2022.
6https://www.calpers.ca.gov/page/newsroom/calpers-news/2024/calpers-will-increase-private-markets-investments
7Anson, “Perspectives on Private Equity and Venture Capital,” Journal of Portfolio Management, 2022.
8PitchBook Private Capital Indexes Q3 2023 page 7 reports adjusted private equity annualized volatility estimates are actually 16.4% since 2000, much higher than the 9.9% reported data, and in-line with the S&P 500 annualized volatility of 16.7%
9Nicolas Rabener, “Private Equity Is Still Equity, Nothing Special Here,” The Journal of Investing, December 2020.
10Bain & Company, “Why Private Equity Is Targeting Individual Investors,” February 2023. 2032 data is forecasted.​


​The views expressed are the views of Fred Alger Management, LLC (“FAM”) and its affiliates as of April 2024. These views are subject to change at any time and may not represent the views of all portfolio management teams. These views should not be interpreted as a guarantee of the future performance of the markets, any security or any funds managed by FAM. These views are not meant to provide investment advice and should not be considered a recommendation to purchase or sell securities.

Risk Disclosures: Investing in the stock market involves risks, including the potential loss of principal. Growth stocks may be more volatile than other stocks as their prices tend to be higher in relation to their companies’ earnings and may be more sensitive to market, political, and economic developments. Local, regional or global events such as environmental or natural disasters, war, terrorism, pandemics, outbreaks of infectious diseases and similar public health threats, recessions, or other events could have a significant impact on investments. Active trading may increase transaction costs, brokerage commissions, and taxes, which can lower the return on investment. Past performance is not indicative of future performance. Investors whose reference currency differs from that in which the underlying assets are invested may be subject to exchange rate movements that alter the value of their investments.

Important Information for US Investors: This material must be accompanied by the most recent fund fact sheet(s) if used in connection with the sale of mutual fund and ETF shares. Fred Alger & Company, LLC serves as distributor of the Alger mutual funds.

The Russell 1000® Growth Index is an unmanaged index designed to measure the performance of the largest 1000 companies in the Russell 3000 Index with higher price-to-book ratios and higher forecasted growth values. The Russell 3000 Index is an unmanaged index considered representative of the U.S. stock market. Russell 3000 Growth index is an unmanaged index considered representative of U.S. growth stocks. Frank Russell Company (“Russell”) is the source and owner of the trademarks, service marks and copyrights related to the Russell Indexes. Russell® is a trademark of Frank Russell Company. Neither Russell nor its licensors accept any liability for any errors or omissions in the Russell Indexes and / or Russell ratings or underlying data and no party may rely on any Russell Indexes and / or Russell ratings and / or underlying data contained in this communication. No further distribution of Russell Data is permitted without Russell’s express written consent. Russell does not promote, sponsor or endorse the content of this communication.

The S&P 500 Index is an unmanaged index generally representative of the U.S. stock market. The S&P indexes are a product of S&P Dow Jones Indices LLC and/or its affiliates and has been licensed for use by Fred Alger Management, LLC and its affiliates. Copyright 2024 S&P Dow Jones Indices LLC, a subsidiary of S&P Global Inc. and/or its affiliates. All rights reserved. Redistribution or reproduction in whole or in part are prohibited without written permission of S&P Dow Jones Indices LLC. S&P® is a registered trademark of Standard & Poor’s Financial Services LLC and Dow Jones® is a registered trademark of Dow Jones Trademark Holdings LLC. Neither S&P Dow Jones Indices LLC, Dow Jones Trademark Holdings LLC, their affiliates nor their third party licensors make any representation or warranty, express or implied, as to the ability of any index to accurately represent the asset class or market sector that it purports to represent and neither S&P Dow Jones Indices LLC, Dow Jones Trademark Holdings LLC, their affiliates nor their third party licensors shall have any liability for any errors, omissions, or interruptions of any index or the data included therein.

The indices presented are provided for illustrative purposes, reflect the reinvestment of dividends and do not assess fees and expenses that would have the effect of reducing returns. Investors cannot invest directly in any index. The index performance does not represent the returns of any portfolio advised by Fred Alger Management, LLC and actual client results might differ materially than the indices shown. Note that past performance is no guarantee of future results.
​​
Alger pays compensation to third party marketers to sell various strategies to prospective investors.

Fre​d Alger & Company, LLC​ / ​100 Pearl Street, New York, NY 10004 / www.alger.com​​ ​/ 212.806.8800
​
​

RecommendedContent Title

ETF Investors

This ETF is different from traditional ETFs.

Traditional ETFs tell the public what assets they hold each day. This ETF will not. This may create additional risks for your investment. Specifically:

You may have to pay more money to trade the ETF’s shares. This ETF will provide less information to traders, who tend to charge more for trades when they have less information.

The price you pay to buy ETF shares on an exchange may not match the value of the ETF’s portfolio. The same is true when you sell shares. These price differences may be greater for this ETF compared to other ETFs because it provides less information to traders.

These additional risks may be even greater in bad or uncertain market conditions.

The differences between this ETF and other ETFs may also have advantages. By keeping certain information about the ETF confidential, this ETF may face less risk that other traders can predict or copy its investment strategy. This may improve the ETF’s performance. If other traders are able to copy or predict the ETF’s investment strategy, however, this may hurt the ETF’s performance. For additional information regarding the unique attributes and risks of this ETF, please refer to the prospectus.

ABOUT ALGER

  • Our History
  • Our Investment Approach
  • Investment Team
  • Careers
  • Charitable Giving
  • We Remember
  • Documents & Forms
  • Fund Literature
  • FAQs

ESG

  • Commitment to Sustainability
  • Alger's Approach to ESG Investing and Oversight
  • Weatherbie’s Approach to ESG Investing and Oversight
  • Redwood's Approach to Responsible Investing
  • Commitment to Culture & Employees

ASSET CLASSES

  • Large Cap
  • Mid Cap
  • Small/SMid Cap
  • International
  • Alternatives
  • Specialty
  • Focus

VEHICLES

  • Mutual Funds
  • ETFs
  • SMAs
  • Institutional Separate Accounts
  • UCITS
  • Collective Investment Trusts

TOOLS

  • Strategy Finder
  • 10 Year Estimator
  • Quarterly Expense Estimator

INSIGHTS

  • Featured Insights
  • Capital Markets Outlook
  • Alger On the Money
  • Alger On the Record
  • The Alger Podcast
  • Search All Insights

NEWSROOM

  • Press Releases
  • In the News

LITERATURE

  • Mutual Funds
  • SMAs
  • Institutional Separate Accounts
  • UCITS

CONTACT US

  • All Inquiries

LEGAL NOTICES

  • Proxy Information
  • 2025 Dividends & Distribution Information
  • Sales Charges
  • Customer Relationship Summaries
  • UK Investor Report
  • Form ADVs
View Mobile Site

Copyright Alger All Rights Reserved Privacy Policy Business Continuity Terms and Conditions
youtube channel LinkedIn Instagram