Log In
Alger
  • About Alger
    • Our History
      Our Investment Approach
      Investment Team
      Careers
      Commitment to Sustainability
      Commitment to Culture & Employees
      Charitable Giving
      We Remember
  • Strategies
    • Strategies Overview
      Asset Classes
      Vehicles
      Strategy Finder
      Large Cap
      Mid Cap
      Small/SMid Cap
      International
      Alternatives
      Specialty
      Focus
      Mutual Funds
      ETFs
      Interval Funds
      SMAs
      Institutional Separate Accounts
      UCITS
      Collective Investment Trusts
  • Insights
    • Insights
      Blogs
      Alger On the Money
      Alger On the Record
      Manager Commentary
      Capital Markets Outlook
      Retirement Solutions
      Viewpoints
      The Power of Focus
  • Newsroom
    Press ReleasesIn the News
  • Contact Us
PART THREE IN THE BEHAVIORAL FINANCE SERIES
.st0 { fill: #999999; } Explore Insights .st0 { fill: #999999; } Subscribe to Emails .st0 { fill: #999999; } .st0 { fill: #999999; } Download PDF

Beyond Selection: How should you size each slice of your portfolio pie?​

Brad Neuman's Photo

Brad Neuman, CFA;

Senior Vice President
Director of Market Strategy

In this paper, we discuss ways to implement practical strategies that may reduce behavioral errors and help improve investment outcomes in a statistically valid way.

Position sizing–or how best to allocate capital among the investments in one’s portfolio–can be one of the most important aspects of achieving long-term investing goals. At Alger, we believe the best way to size positions is to follow a systematic process. In this paper, we discuss ways to implement practical strategies that may reduce behavioral errors and help improve investment outcomes in a statistically valid way.

Position Sizing Can Be a Challenge

The vast majority of investing literature deals with what to buy or which investments will have the best returns. However, decisions beyond security or fund selection may be more important to returns than many investors believe. Of course selection is important, but how exactly should an investor size those investments within a portfolio?

Many investors may not use an adequate framework to address the question of how to size positions within a portfolio. Even portfolios consisting of investments with high probabilities of success can yield surprisingly poor results if they are not sized correctly, based on academic studies.

One such study was done by Victor Haghani and Richard Dewey.1 They gave more than 60 individuals with finance backgrounds the opportunity to bet real money on a virtual coin flip that was programmed to land 60% of the time on heads and 40% on tails. As a result, the participants could win or lose on any given flip. The subjects were given $25 and could choose how much to wager on a coin flip, so if they bet $10 on heads, for example, and it came up tails, they would have lost $10. One might expect to earn a lot of money in this experiment given the favorable odds and the ability to place approximately 300 bets over the half hour allotted for the experiment.

The results of the study, however, were disappointing (see Figure 1). While predictive modeling suggests that nearly everyone should have theoretically earned the maximum payout of $250 if they had a proper sizing framework, only 21% of participants actually achieved the highest return. Even worse, one-third of participants lost money despite the favorable odds.

So, what went wrong?

One of the problems is that having a good probability of success can be undone by betting too much of one’s capital. For example, betting everything on one flip and losing leaves one unable to play in the future and potentially reap additional rewards over subsequent periods. Unfortunately, about 30% of participants did bet their entire balance on one flip, causing them to have suboptimal results.

Other participants bet erratically—too small and then too big—making it clear that they lacked a consistent framework for decision-making.
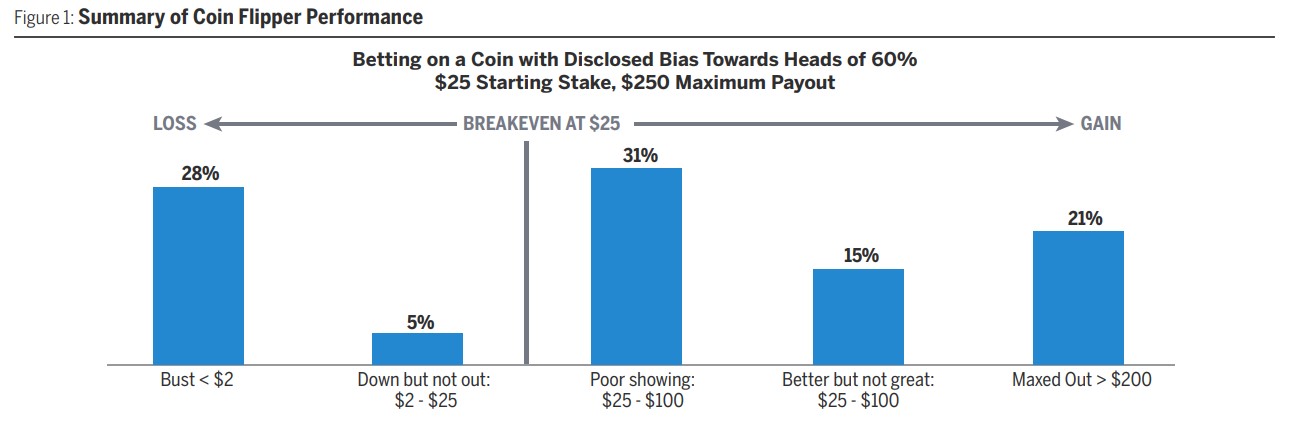
Bar Chart Labeled Betting on a Coin with Disclosed Bias Towards Heads of 60%  $25 Starting Stake, $250 Maximum Payout

Source: Victor Haghani and Richard Dewey, “Rational Decision Making under Uncertainty: Observed Betting Patterns on a Biased Coin,” Journal of Portfolio Management, Spring 2017.

​

What would a more consistent framework look like? One longstanding framework is the Kelly Criterion, which is a formula to help investors calculate the optimal size of a position within their portfolio. Using the Kelly Criterion for the coin-flip example of 2*P-1, where P is the probability of winning, would have suggested an optimal bet of 20% of one’s funds (2* 60% -1) for each bet.

In fact, a simulation that the study’s authors conducted indicated a 95% probability of hitting the $250 maximum payout if one were to bet 20% on each flip in a systematic way.

As such, if one were to follow the Kelly Criterion for the coin flipping example, the amount bet would increase as one’s balance grew and vice versa. Applying this idea to investing, should investors allocate more to a stock as it goes up and less as it declines?

Not necessarily. In investing, there are no consistent odds of winning like that which is built into the artificial structure of the coin flipping exercise. Investing is variable, with upside and downside changing dynamically with stock prices, whereas it is fixed in the coin flipping example.2

If equity investors believe their win-loss ratio or upside/downside has improved as a result of a decline in the stock, fund, or index, it may be rational of them to increase the position. While a 10% drawdown in one’s balance would suggest a 10% smaller wager would be appropriate according to the simple Kelly Criterion, that decline may be more than offset in equity investing by the increase in the win-loss ratio.3

The Kelly Criterion has many fans among professional investors, such as Warren Buffett and Charlie Munger, and Bill Gross. However, updating win-loss ratios in real time using valuation and fundamental analysis may be impractical for many investors. Acknowledging the difficulty in applying these types of analyses, we believe many investors may want to choose to utilize a simpler process for sizing investments in their portfolios.

A Real-World Solution?

Morningstar estimates that the average investor in volatile sector mutual funds & ETFs under-performed the actual returns of those funds by approximately 150bps annually in the 10 years ending 2024. Morningstar’s analysis suggests that much of the underperformance was due to investors buying or increasing positions after strong performance or vice versa.4

What would be a better strategy? Morningstar has previously estimated that dollar-cost averaging or investing a fixed amount on a regular basis such that more shares are purchased as an investment declines in value and fewer shares purchased as the investment appreciates, may have improved returns and eliminated the investor underperformance.

Conclusion

At Alger, we believe that simply finding a good investment for a portfolio is not enough. Investors may do well to think beyond selection and focus on the importance of sizing. Sizing positions with respect to probability of success and upside/downside may help optimize a portfolio. Position sizes that are too large risk crippling a portfolio if a low probability event occurs while not sizing aggressively enough may waste favorable opportunities. Utilizing a disciplined framework may go a long way in limiting behavioral errors and capitalizing on fundamentally favorable investments.
Recommended Insights for You:

1 Source: “Rational Decision Making under Uncertainty: Observed Betting Patterns on a Biased Coin,” Victor Haghani and Richard Dewey, Journal of Portfolio Management, Spring 2017.

2 For situations where upside and downside are not the same, the formula for the Kelly Criterion is a bit more complex: the optimal sizing equals the winning probability minus the quotient of the losing probability divided by the win-loss ratio. The “win-loss ratio” is the upside divided by downside return potential.

3 When win-loss ratios are not static, as may be the case in equities, investors may want to use the Merton Rule. This formula determines the ideal position size by dividing a stock's excess return (expected return minus the risk-free rate) by its variance. This result can then be scaled down based on personal risk aversion.

4 Source: Morningstar Mind the Gap 2025.


The views expressed are the views of Fred Alger Management, LLC ("FAM") and its affiliates as of June 2026. These views are subject to change at any time and may not represent the views of all portfolio management teams. These views should not be interpreted as a guarantee of the future performance of the markets, any security or any funds managed by FAM. These views are not meant to provide investment advice and should not be considered a recommendation to purchase or sell securities.

Risk Disclosures: Investing in the stock market involves risks, including the potential loss of principal. Growth stocks may be more volatile than other stocks as their prices tend to be higher in relation to their companies' earnings and may be more sensitive to market, political, and economic developments.

This material must be accompanied by the most recent fund fact sheet(s) if used in connection with the sale of mutual fund and ETF shares. Fred Alger & Company, LLC serves as distributor of the Alger mutual funds and ETFs.

Alger pays compensation to third party marketers to sell various strategies to prospective investors.

A subscription fee is paid to Morningstar to access research, ratings, rankings and other investment tools.

Fred Alger Management, LLC 100 Pearl Street, New York, NY 10004 / www.alger.com

SIZINGWP0626

RecommendedContent Title

ETF Investors

This ETF is different from traditional ETFs.

Traditional ETFs tell the public what assets they hold each day. This ETF will not. This may create additional risks for your investment. Specifically:

You may have to pay more money to trade the ETF’s shares. This ETF will provide less information to traders, who tend to charge more for trades when they have less information.

The price you pay to buy ETF shares on an exchange may not match the value of the ETF’s portfolio. The same is true when you sell shares. These price differences may be greater for this ETF compared to other ETFs because it provides less information to traders.

These additional risks may be even greater in bad or uncertain market conditions.

The differences between this ETF and other ETFs may also have advantages. By keeping certain information about the ETF confidential, this ETF may face less risk that other traders can predict or copy its investment strategy. This may improve the ETF’s performance. If other traders are able to copy or predict the ETF’s investment strategy, however, this may hurt the ETF’s performance. For additional information regarding the unique attributes and risks of this ETF, please refer to the prospectus.

ABOUT ALGER

  • Our History
  • Our Investment Approach
  • Investment Team
  • Careers
  • Charitable Giving
  • We Remember
  • Documents & Forms
  • Fund Literature
  • FAQs

ESG

  • Commitment to Sustainability
  • Alger's Approach to ESG Investing and Oversight
  • Weatherbie’s Approach to ESG Investing and Oversight
  • Redwood's Approach to Responsible Investing
  • Commitment to Culture & Employees

ASSET CLASSES

  • Large Cap
  • Mid Cap
  • Small/SMid Cap
  • International
  • Alternatives
  • Specialty
  • Focus

VEHICLES

  • Mutual Funds
  • ETFs
  • Interval Funds
  • SMAs
  • Institutional Separate Accounts
  • UCITS
  • Collective Investment Trusts

TOOLS

  • Strategy Finder
  • 10 Year Estimator
  • Quarterly Expense Estimator

INSIGHTS

  • Featured Insights
  • Capital Markets Outlook
  • Alger On the Money
  • Alger On the Record
  • The Alger Podcast
  • Search All Insights

NEWSROOM

  • Press Releases
  • In the News

LITERATURE

  • Mutual Funds
  • SMAs
  • Institutional Separate Accounts
  • UCITS

CONTACT US

  • All Inquiries

LEGAL NOTICES

  • Proxy Information
  • 2026 Estimated Dividends & Distribution Information
  • Sales Charges
  • Customer Relationship Summaries
  • UK Investor Report
  • Form ADVs
  • Interval Fund Repurchasing Schedule
View Mobile Site

Copyright Alger All Rights Reserved Privacy Policy Business Continuity Terms and Conditions
youtube channel LinkedIn Instagram